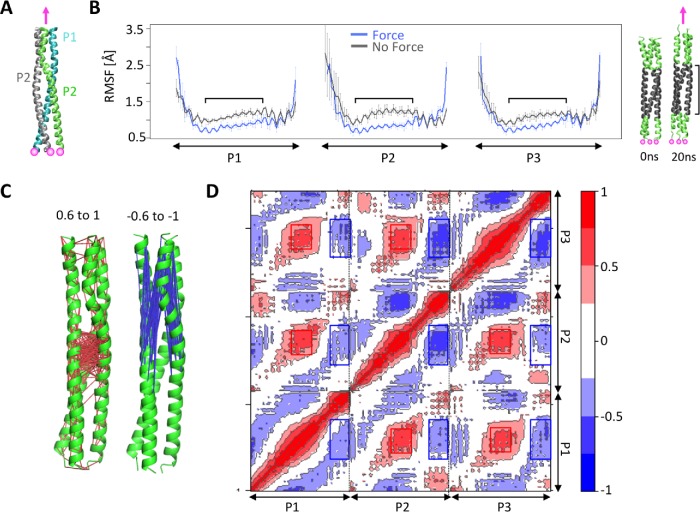
FIGURE 7:
Force transmission across the CC domain of SUN2. (A) Model of CC1 of SUN2 under force. Three protomers in the SUN2 CC1 trimer (P1, P2, and P3) were pulled at a constant velocity in the direction shown with a pink arrow. Forces were applied to the C-terminal residue of each protomer while the Cα residues of the N-terminal residues were fixed (shown with pink circles). (B) RMSF of CC1 protomers (P1, P2, and P3) under force, compared with a no force control. Average values are shown for three independent simulation runs, and error bars show data spread. Regions where the RMSF is different between the two conditions are indicated on the plot and mapped onto the structure on the left. (C, D) Dynamic cross-correlation between various regions of each model under force, averaged over MD simulation time. Positive cross-correlations (red) represent fluctuations/displacements in the same direction, whereas negative cross-correlation values (blue) represent fluctuations/displacements in the opposite direction. The residues that are positively correlated with a correlation value between 0.6 and 1 are connected with red lines and residues that are negatively cross-correlated with a correlation value between –0.6 and –1 are connected with blue lines in C, while corresponding residues are represented with red and blue boxes in D.

