FIGURE 5:
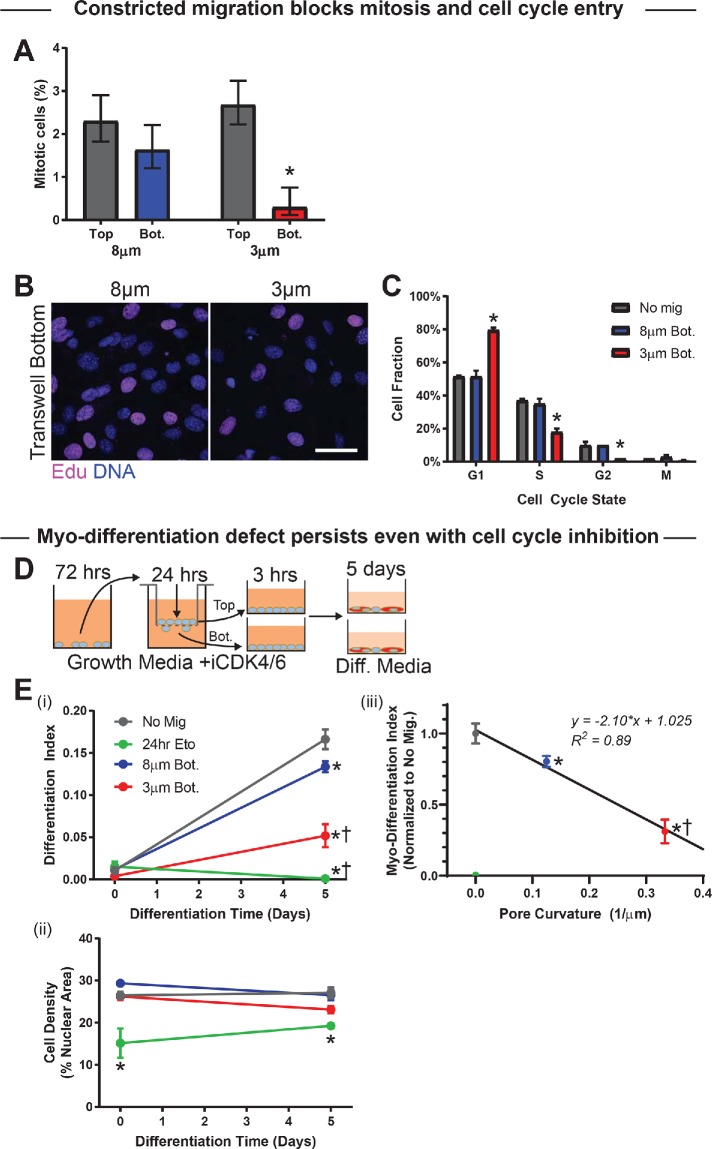
Constricted migration blocks cell cycle in myoblasts. (A) Percentage mitotic C2C12 myoblasts on the top and bottom of 3- and 8-μm transwell membranes. Migration through 3-μm pores suppresses the mitotic population (N = 337–969 cells). (B, C) After 24-h transwell migration, the thymidine analog EdU was added to the top and bottom of each pore membrane for 1 h before fixation and staining. The EdU and DNA intensities of individual cells—measured by immunofluorescence microscopy—were used to classify the cells as G1, S, G2, or mitotic (M). Cells show less EdU incorporation after migration through 3-μm than 8-μm pores, indicating fewer cells in the S-phase of the cell cycle. Scalebar = 50 μm. Cell cycle phase distributions for nonmigrated (Top) cells, cells that have migrated through 8-μm pores, and cells that have migrated through 3-μm pores. Migration through 3-µm pores leads to enrichment of G1 and corresponding decreases in S and G2 phases, suggesting a cell cycle delay, whereas 8 μm–pore migration does not affect cell cycle. N = 199–201 cells. (D) (Left) Proliferation of C2C12 cells was blocked with CDK4/6 inhibitor (1 µM; CDK4/6i) before and during transwell migration; CDK4/6i was washed out when cells were placed in differentiation media. (E) (i) Even with cell cycle inhibition, differentiation of cells after 5 d is significantly reduced among 3 μm pore–migrated cells. Differentiation is also reduced—to negligible levels—among nonmigrated cells treated for 24 h with the DNA-damaging agent etoposide. N = 3 samples. (ii) Cell density is consistent throughout the differentiation time course, indicating absence of proliferation with CDK4/6i. Cell density is also consistent between conditions, with the exception of the etoposide-treated population, which has low density. The persistence of the migration-induced differentiation defect, even with cell cycle inhibition, indicates that the delay is not purely due to a cell cycle defect. (iii) Differentiation index at day 5 correlates negatively with pore curvature (i.e., inverse of pore diameter); cells show less differentiation after migrating through pores that impose higher Gaussian curvature on the cell membrane. * indicates significant (p < 0.05) difference from no migration or † from 8-μm migration.

