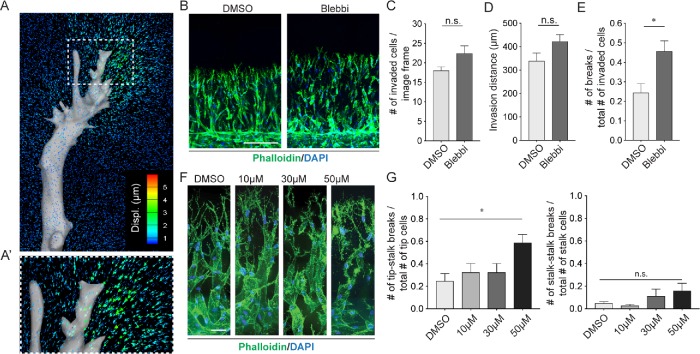
FIGURE 1:
Angiogenic sprouts generate contractile forces necessary to maintain multicellular migration. (A) A representative map of matrix deformations (colored arrows) generated by an endothelial sprout (gray). (A’) A zoom-in view of the front region of the invading tip cell. (B) Representative F-actin (phalloidin, green) and nuclei (DAPI, blue) images of sprouts at day 5 after sprouting under 30 μM blebbistatin or DMSO control treatment. Scale bar is 200 μm. (C) Quantification of invasion density as measured by the number of invaded nuclei. (D) Quantification of invasion distance as measured by distance from edge of main channel to end of tip cell invasive front. (E) Quantification of cell–cell breakages normalized to total number of invaded cells. (F) Representative F-actin (phalloidin, green) and nuclei (DAPI, blue) images of indicated conditions at day 4 after 24-h blebbistatin treatment. Scale bar is 50 μm. (G) Quantification of detached tip cells (left plot) and stalk cells (right plot) following 24-h blebbistatin treatment. NDMSO = 3 devices, 4 fields of view per device, NBlebbi = 5 devices, 4 fields of view per device. Bars represent mean ± SEM. * represents p < 0.05 as determined by a t test (C, D, E) or one-way ANOVA with post hoc Tukey HSD test (G).

