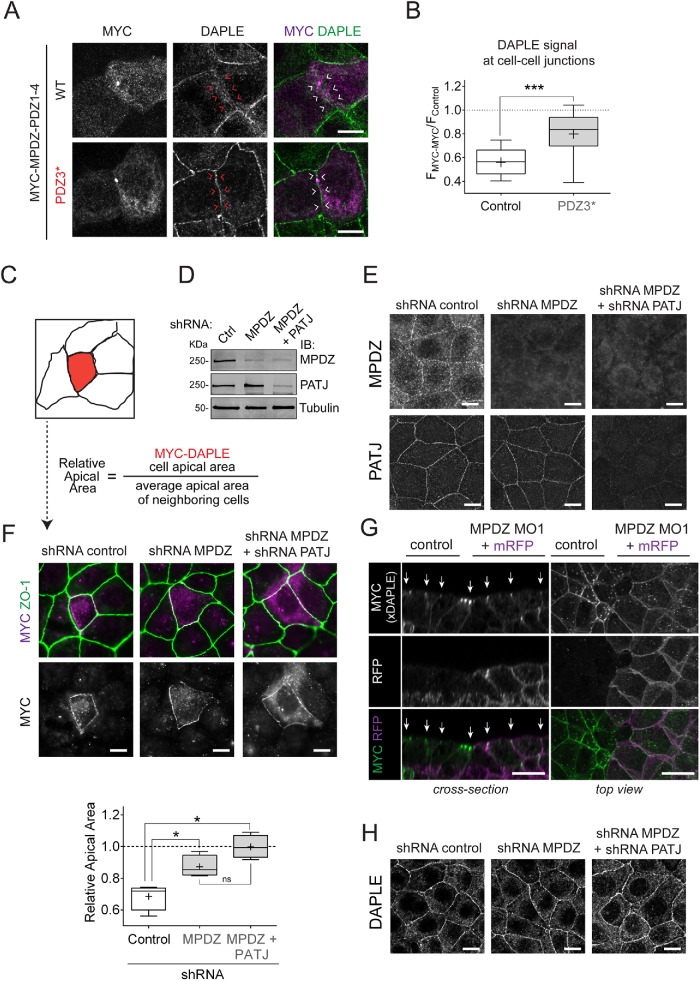
FIGURE 4:
MPDZ is required for DAPLE-induced apical cell constriction. (A) Representative fluorescence microscope pictures of EpH4 cells sparsely expressing MYC-MPDZ-PDZ1-4 and costained for MYC (magenta) and DAPLE (green). (B) Quantification of DAPLE at cell–cell boundaries of EpH4 cells expressing MYC-MPDZ-PDZ1-4 (FMYC-MYC) relative to the signal in control cells (FControl). Results are presented as box-and-whisker plots of n = 3 independent experiments per condition. The “+” indicates the average. ***, p < 0.001 using the Mann-Whitney test. (C) Diagram depicting the assay used to quantify the apical cell constriction induced by expression of DAPLE. The “relative apical area” of MYC-DAPLE-transfected cells is calculated by dividing the area of the DAPLE-expressing cell by the average of the area of the adjacent cells. (D, E) Validation of shRNA-mediated depletion of MPDZ and PATJ in EpH4 cells. Cell lines stably expressing the indicated shRNAs were generated by lentiviral transduction followed by selection, and the reduction in MPDZ and PATJ protein expression was confirmed by immunoblotting (“IB” in D) and immunofluorescence staining (E). (F) Quantification of the relative apical area of DAPLE-transfected cells compared with neighboring, untransfected cells shows that depletion of MPDZ or MPDZ and PATJ impairs DAPLE-induced apical cell constriction. Representative fluorescence microscopy pictures of the indicated EpH4 cell lines sparsely expressing MYC-DAPLE and costained for MYC (magenta) and ZO-1 (green) are shown on top, and a graph with the quantification data across independent experiments is shown on the bottom. Results are presented as box-and-whisker plots of n = 4 independent experiments per condition. The “+” indicates the average. *, p < 0.05 using the Mann-Whitney test. (G) Whole-mount staining (MYC-xDAPLE, green; mRFP, magenta) of Xenopus embryos bilaterally injected with xDAPLE mRNA and unilaterally coinjected with xMPDZ MO1 and a lineage tracer (mRFP). (H) Confocal fluorescence microscopy pictures of monolayers of EpH4 cell lines depleted of MPDZ or MPDZ/PATJ show no difference in endogenous DAPLE staining compared with control cells. Maximum-intensity projection views of the apical domain of the cell monolayers are shown. All images presented in this figure are representative results of n ≥ 3 experiments. Scale bars: 25 µm (G); 5 µm (all others).

