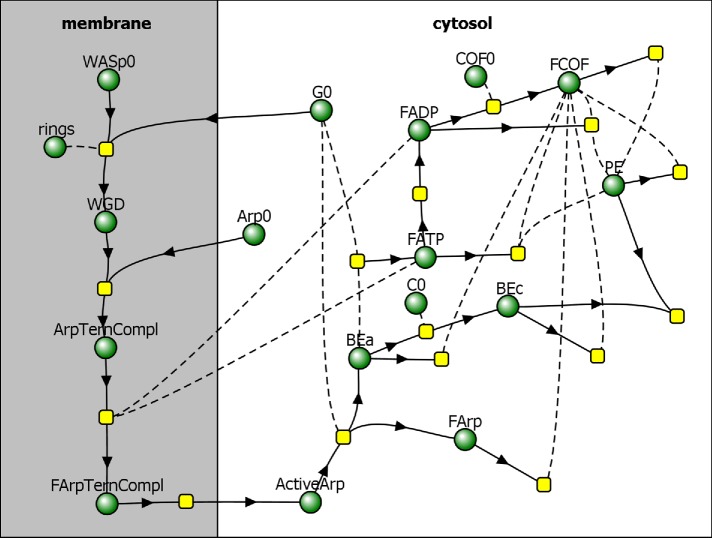
FIGURE 1:
Reaction diagram corresponding to the kinetic model by Berro et al. (2010), with added partitioning of species between membrane and cytosol. Directions of arrows toward or away from reaction nodes (yellow squares) determine roles of species (green circles) in a particular reaction as reactants or products, and reactions without products describe disappearance of reactants from the patch. Species connected to reactions by dashed curves act as “catalysts,” that is, they are not consumed in those reactions.

