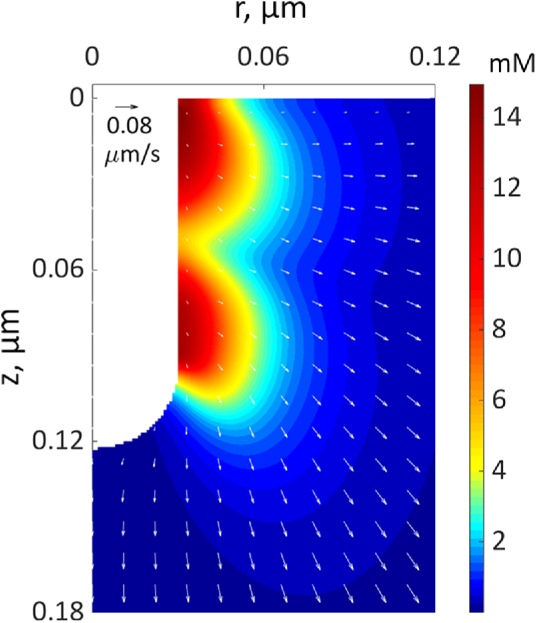
FIGURE 4:

A snapshot from a simulation of an elongating endocytic invagination shown for r–z cross-section of three-dimensional geometry. The extracellular space is white. The color shows the density distribution of actin filaments, and the arrows show the local velocities of their movements at the peak of actin assembly (see Figure 7C for snapshots at other time points). The velocity scale bar in the upper left corner corresponds to 0.08 μm/s.
