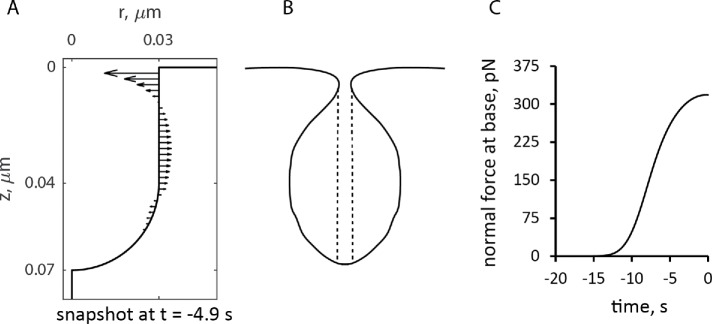
FIGURE 6:
Simulated forces exerted by actin assembly normal to the endocytic tubule. (A) Distribution of forces at ≈5 s before peak on a static tubule. (B) Rough sketch of a plausible shape if the membrane lining the invagination is flexible. The vertical dashed lines show the area of the pore that determines the force produced by the turgor pressure. (C) Time course of the force normal to the tubule at its base. Time zero is the peak of actin assembly.

