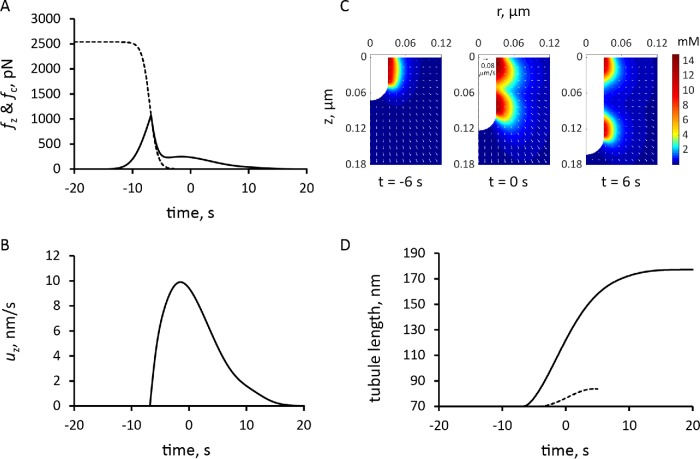
FIGURE 7:
Simulation of endocytic tubule elongation with the force threshold from turgor pressure decreasing with time. Time zero is the peak of actin assembly. (A) Time course of the assumed decrease in force threshold due to turgor pressure, fc (dashed curve), and the simulated pushing force, fz (solid line). (B) Time course of the variation in the speed of invagination, which begins when fz is greater than fc. (C) Snapshots of r–z sections of the actin filament density around the endocytic tubule and its velocities (arrows; scale bar in upper left corner of snapshot in the middle corresponds to 0.08 μm/s); see also Supplemental Movie S2. (D) Comparison of the time courses of tubule elongation with decreasing force from turgor pressure (solid line) against that with a fixed threshold due to turgor pressure in Figure 5B (dashed curve).

