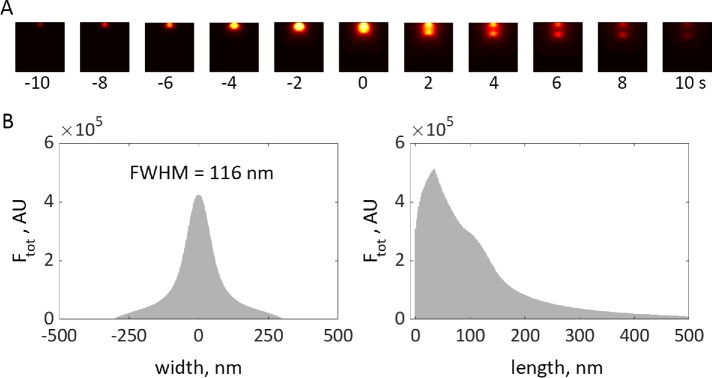
FIGURE 8:
Simulation of elongating tubule with time-dependent force threshold is consistent with experimental data. (A) Heat maps of simulated actin density (see Figure 7), projected on plane of image and subjected to median filtering to mimic 35-nm resolution limit due to convolution with point-spread function, are shown for selected time points. See “Methods” in the Supplemental Text for details of how simulation results were processed for this figure; see Supplemental Figure 2 for results before filtering. (B) Width and length distributions of actin density, obtained by integrating results of A over time, are consistent with experimental data in Arasada et al. (2018). FWHM is the full width of a distribution at half-maximum.

