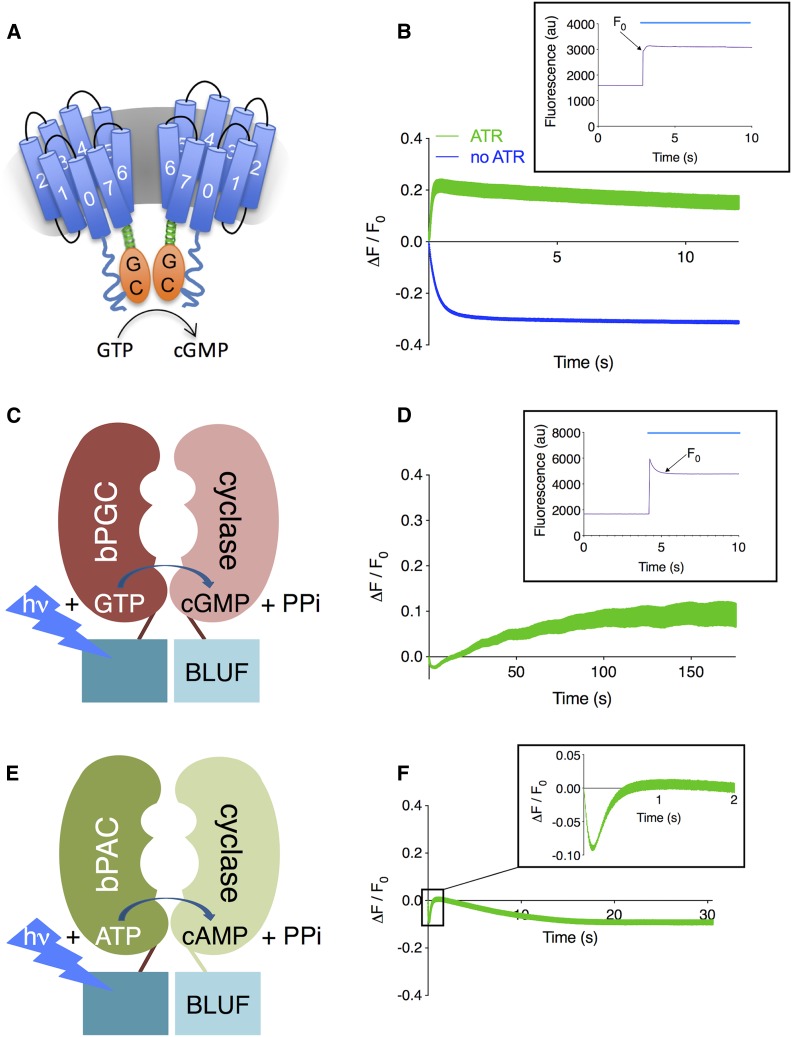
Figure 2.
FlincG3 fluorescence increases upon stimulation of blue-light-activated guanylyl cyclases when coexpressed in body wall muscle cells. (A) BeCyclOp is a fungal blue-light-activated guanylyl cyclase that generates cGMP with a turnover rate of ∼17 cGMP per second at 20°; this figure is adapted from Figure 4A in Gao et al. (2015) under the Creative Commons Attribution License (https://creativecommons.org/licenses/by/4.0/). (B) ΔF/F0 for FlincG3 fluorescence intensity in myo-3p::CyclOp::SL2::mCherry; myo-3p::FlincG3 animals grown in the absence and presence of all-trans-retinal (ATR). These animals express BeCyclOp and FlincG3 specifically in body wall muscle cells. n = 6 animals for FlincG3 fluorescence intensity without ATR (blue, bottom); n = 5 animals for FlincG3 fluorescence intensity with ATR (green, top). Inset shows the original traces with ATR and indicates F0; blue line indicates duration of blue light illumination. Traces are shown with SEM. (C) bPGC is a bacterial blue-light-activated guanylyl cyclase containing a BLUF (sensors of blue light using FAD) domain with an estimated turnover rate of 0.2 cGMP per second (Ryu et al. 2010). (D) ΔF/F0 for FlincG3 fluorescence intensity in myo-3p::bPGC::SL2::mCherry; myo-3p::FlincG3 animals (n = 5 animals, 27 ROIs). These animals express bPGC and FlincG3 specifically in body wall muscle cells. Inset shows original traces and indicates F0; blue line indicates duration of blue light illumination. Traces are shown with SEM. (E) bPAC is a bacterial blue-light-activated adenylyl cyclase containing a BLUF (sensors of blue light using FAD) domain. In vitro cAMP production in the presence of blue light is 10 ± 2 nmol cAMP per minute per milligram (Stierl et al. 2011). (F) ΔF/F0 for FlincG3 fluorescence intensity in myo-3p::bPAC::SL2::mCherry, myo-3p::FlincG3 animals. These animals express bPAC and FlincG3 specifically in body wall muscle cells. n = 7 animals. Inset shows the average of traces during the first 2 sec of recording. Traces are shown with SEM.

