Figure 5.
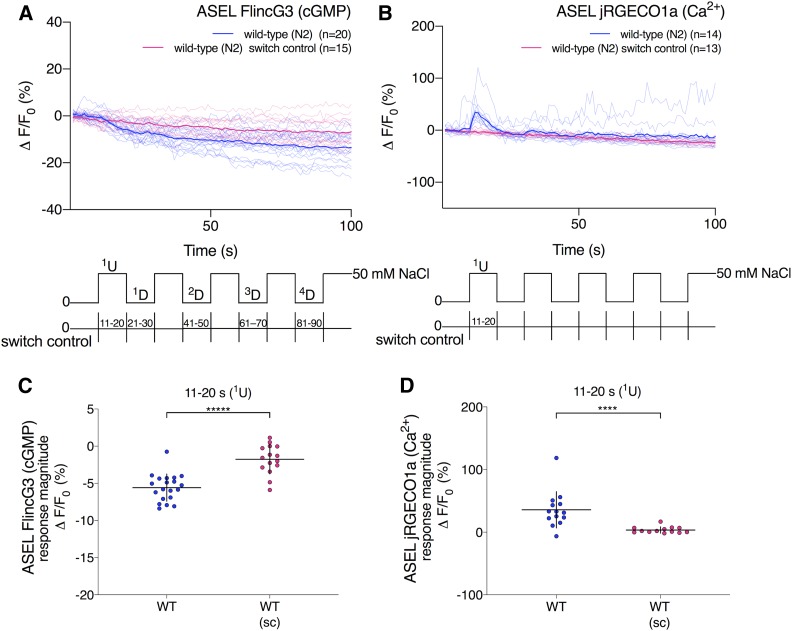
FlincG3 and jRGECO1a fluorescence in the ASEL cell body are opposite in sign in response to a 0–50 mM NaCl upstep. (A) Average fluorescence response (ΔF/F0 (%)) of FlincG3 in the ASEL cell body shown as bolded traces responding to either ten 10-sec steps between 0 and 50 mM NaCl or switch control (represented at the bottom of the panel). Thinner traces are from individual recordings for each condition. ASEL FlincG3 fluorescence in wild-type (N2) animals decreases in response to a 0–50 mM NaCl upstep (blue traces). These responses are not seen in wild-type animals exposed to switch control (pink traces). n = 20 and n = 15 animals for wild-type and wild-type switch control, respectively. (B) Average fluorescence response (ΔF/F0 (%)) of jRGECO1a in the ASEL cell body shown as bolded traces responding to either ten 10-sec steps between 0 and 50 mM NaCl or switch control (represented at the bottom of the panel). Thinner traces are from individual recordings for each condition. ASEL jRGECO1a fluorescence in wild-type (N2) animals increases in response to a 0–50 mM NaCl upstep (blue traces). These responses are not seen when wild-type animals are exposed to switch control (pink traces). n = 14 and n = 13 animals for wild-type and wild-type switch control, respectively. (C) FlincG3 fluorescence in the ASEL cell body decreases in response to a 0–50 mM NaCl upstep in wild-type animals. The response magnitudes for the first 0–50 mM NaCl upstep between wild type and wild-type switch control animals are different (n = 14 (first set, blue; wild type), n = 13 (second set, pink; switch control); permutation test P < 0.00001). Individual dots are the response magnitudes calculated for each animal. sc, switch control. Horizontal bars indicate mean; vertical error bars indicate ± SD. See Materials and Methods for details of statistical analysis. (D) jRGECO1a fluorescence in the ASEL cell body increases in response to a 0–50 mM NaCl upstep in wild-type animals. The response magnitudes for the first 0–50 mM NaCl upstep between wild type and wild-type switch control animals are different (n = 14 (first set, blue; wild type), n = 13 (second set, pink; switch control); permutation test P < 0.0001). Individual dots are the response magnitudes calculated for each animal. sc, switch control. Horizontal bars indicate mean; vertical error bars indicate ± SD. See Materials and Methods for details of statistical analysis.

