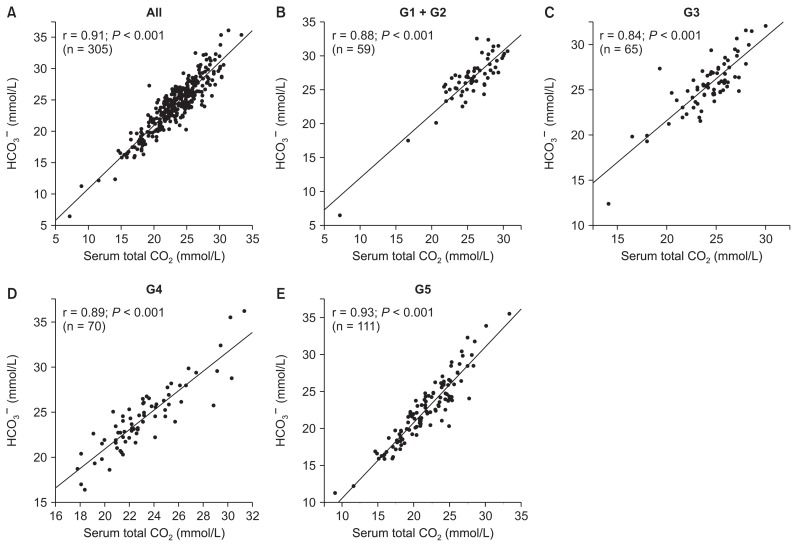
Figure 1. Relationships between serum total carbon dioxide (CO2) and measured bicarbonate ion (HCO3−) concentration according to chronic kidney disease (CKD) stage.
(A) All patients, (B) patients with CKD stage G1 + G2, (C) patients with CKD stage G3, (D) patients with CKD stage G4, (E) patients with CKD stage G5.

