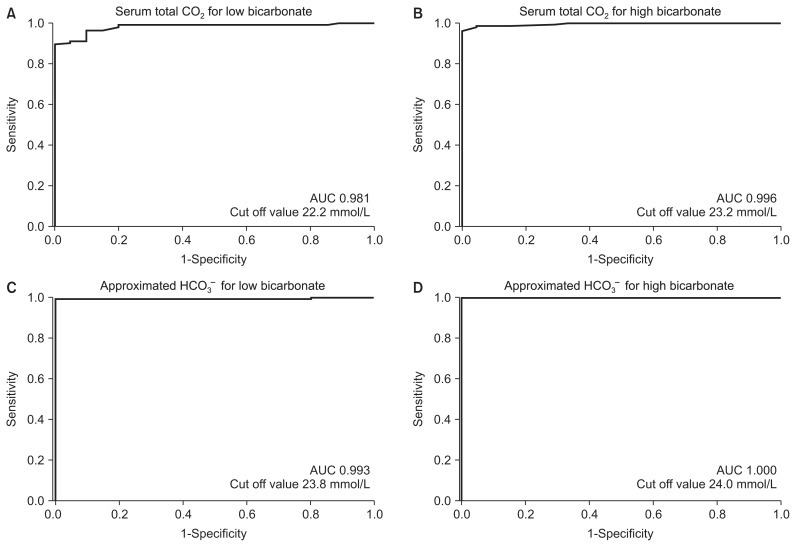
Figure 3. Receiver operating characteristic (ROC) curve analysis for detecting low bicarbonate (bicarbonate ion [HCO3−] < 24 mmol/L) and high bicarbonate (HCO3− ≥ 24 mmol/L).
(A) The ROC curve of serum total carbon dioxide (CO2) for low bicarbonate. (B) The ROC curve of serum total CO2 for high bicarbonate. (C) The ROC curve of approximated HCO3− concentration for low bicarbonate. (D) The ROC curve of approximated HCO3− concentration for high bicarbonate.
AUC, area under the curve.

