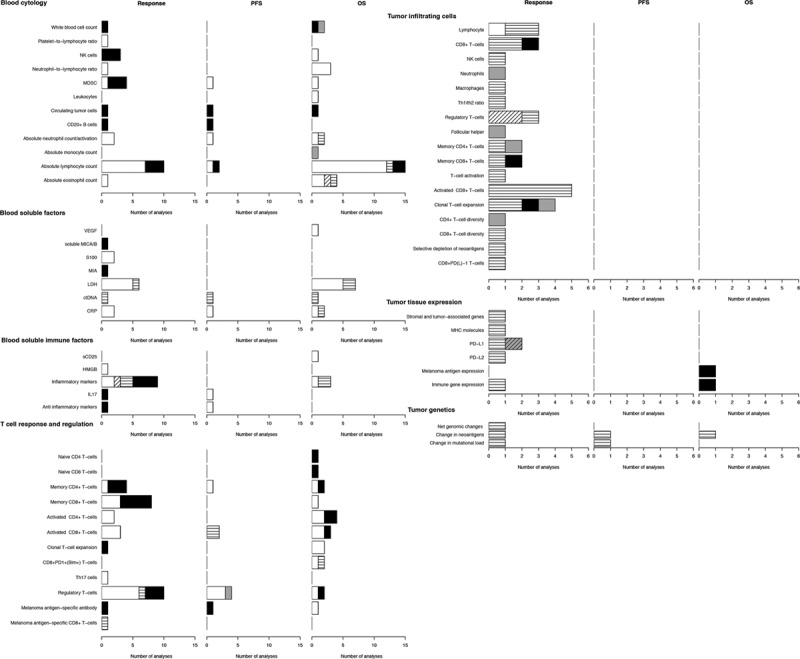
Fig. 3.

Blood and tumor tissue biomarker analyzed for immune checkpoint inhibitor (ICI) treatment. Graphs show the number of analyses per biomarker type for correlations with clinical response, progression-free survival (PFS), or overall survival (OS) upon ICI therapy. White bars, significant CTLA-4 correlation; black bars, non-significant CTLA-4 correlation; horizontal lines in white bars, significant PD-1 correlation; gray bars, non-significant PD-1 correlation; white bar with diagonal lines, significant both CTLA-4 and PD-1 correlation.
