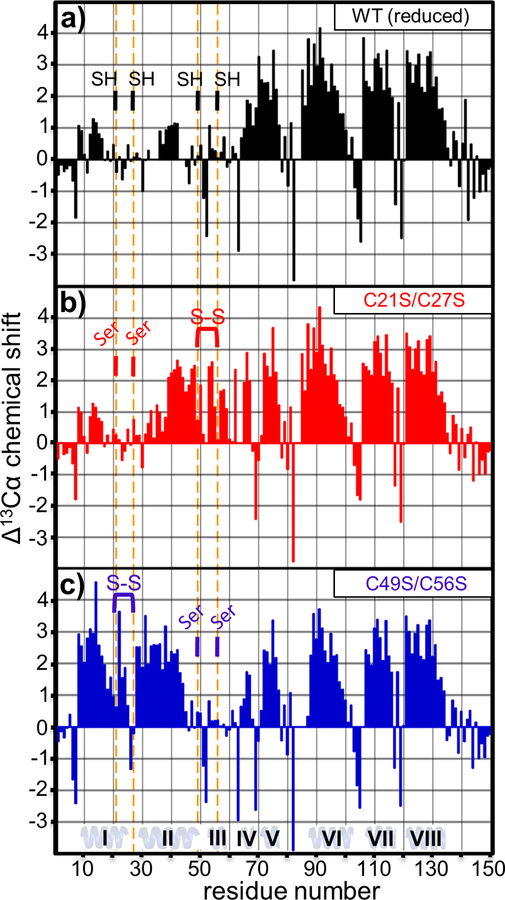
Figure 2. ∆13Cα chemical shift analysis.
The 13Cα differential chemical shift was plotted as a function of residue for: (a) reduced wild-type cytoplasm-entry domain, (b) oxidized C21S/C27S domain and (c) oxidized C49S/C56S domain. Vertical orange lines show the positions of Cys residues or Cys to Ser substitutions. Cys residues are indicated as reduced (SH) or oxidized (S-S).

