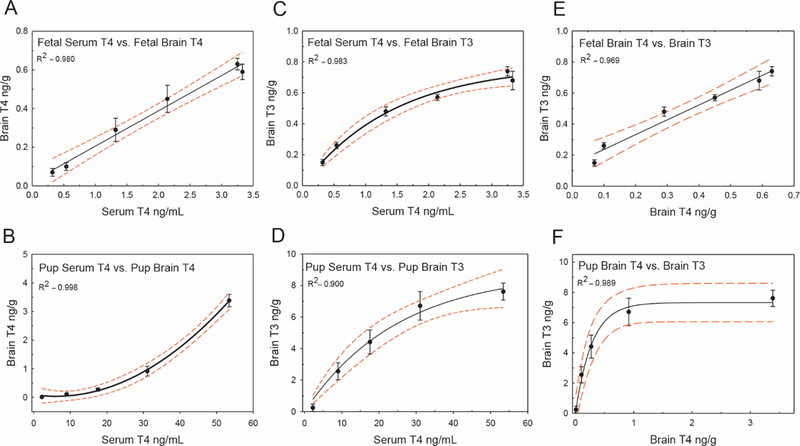
Figure 3.

Quantitative relationships between serum and brain THs. All hormone values plotted are means, as determined by LC/MS/MS or RIA (see “Materials and Methods” section). A, Serum T4 versus brain T4 in the GD20 fetus. Observations correlate well to a standard linear equation. B, Pup serum T4 correlates to brain T4 concentrations on PN14 as a quadratic relationship. C, Serum T4 versus brain T3 in the GD20 fetus is fitted by an exponential equation relationship. D, Pup serum T4 and brain T3 are also modeled well as an exponential equation, similar to what is observed in the fetus. E, Fetal brain T3 levels versus brain T4 are well represented by a linear equation. F, Pup brain T3 versus brain T4 is best fit as an exponential relationship. R2 values for each relationship are shown. In all graphs error bars represent 6 SEM, and dashed lines the 95% CIs.
