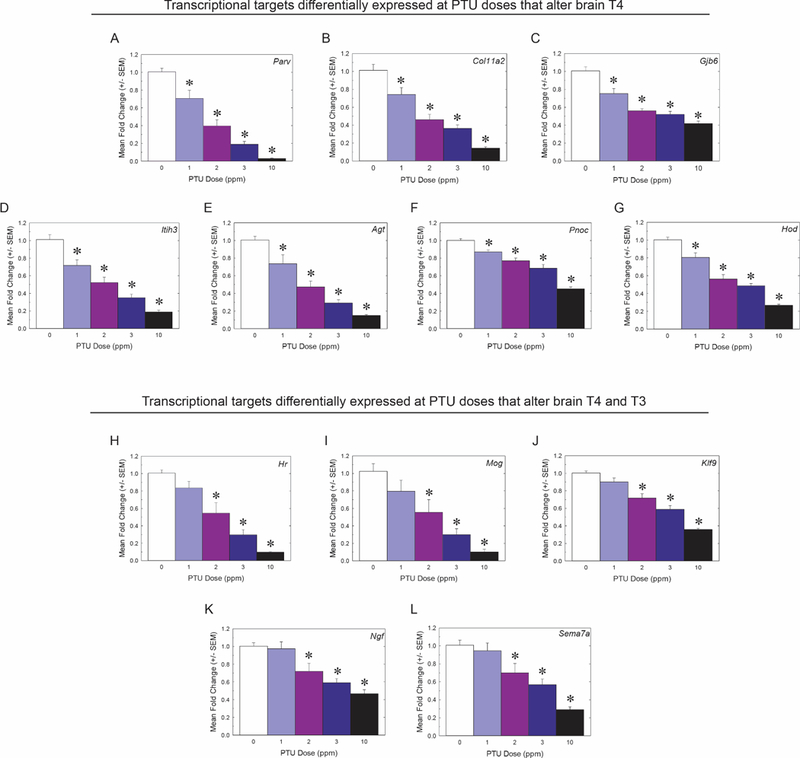
Figure 6.

Gene expression changes in the PN14 neocortex that reflect the brain T4/T3 deficit. All PTU doses represent the maternal dose administered. A–G, Transcriptional targets that were differentially expressed at every PTU dose tested at this stage (1, 2, 3, and 10 ppm); these PTU exposures also induced a significant T4 decrease in the PN14 brain. H–K, These candidate genes were differentially expressed in the PTU treatments that induced statistically significant decreases in both T4 and T3 within the brain (2, 3, and 10 ppm PTU). n 1/4 7 were analyzed for each dose group; significant differential expression of genes was determined by an overall ANOVA, a= 0.009. All asterisks represent significant dose effects as determined by mean contrast tests, a= 0.05. All error bars represent 6 SEM.
