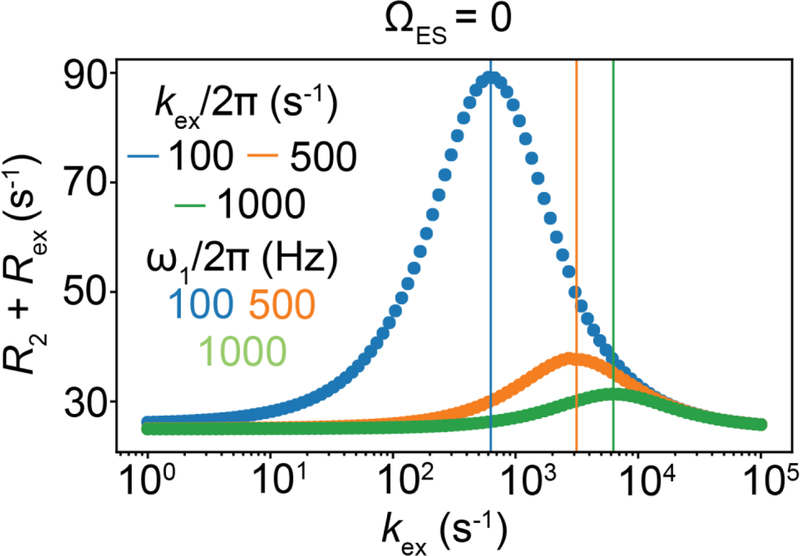
Figure 19.
Variation of R2 + Rex with kex during an R1ρ experiment when on-resonance with the ES (pES = 0.01, , γ(1H)B0/2π = 700 MHz, R1,GS = R1,ES = 2.5 s −1 and R2,GS = R2,ES =22.5 s−1). Spin-lock amplitudes are color-coded. Vertical lines denote the indicated values of kex. The initial alignment of the magnetization during the B-M simulations was performed as described in Section 6.1.

