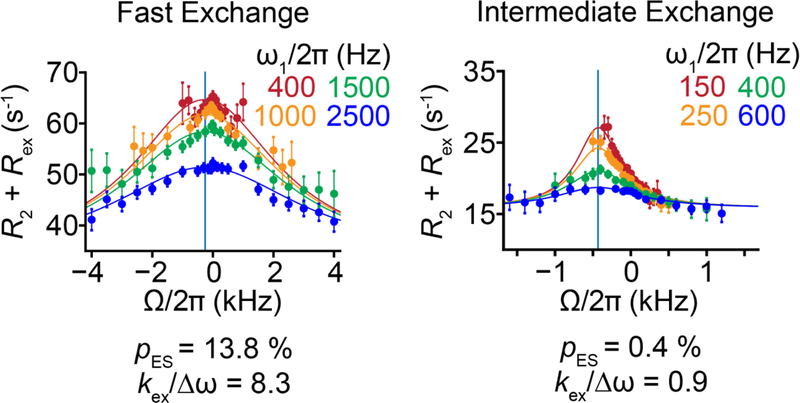
Figure 20.
Representative experimental off-resonance R1ρ RD profiles for two-state exchange under fast and intermediate exchange. The profiles were measured for U31-C1′ and C24-C1′ in HIV-1 TAR at 25 °C and 35 °C, respectively[166]. Spin-lock amplitudes are color-coded. Error bars represent experimental uncertainties determined by a Monte-Carlo scheme (Section 6.3). Solid lines denote global fits to the RD data using the B-M equations[166]. The initial alignment of the magnetization during the B-M fitting was performed as described in Section 6.1. Gray vertical lines correspond to the offset value when on resonance with the ES. Reproduced with permission from [166].

