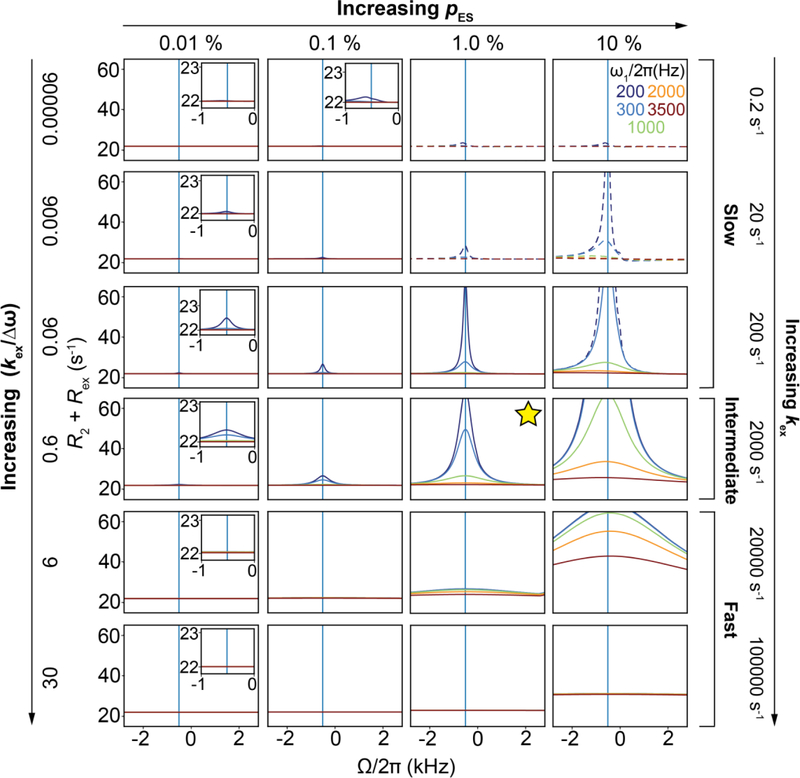
Figure 21.
Variation of R2 + Rex during off-resonance R1ρ experiments, for a wide range of kex and pES values for two-state exchange, simulated using the B-M equations. Horizontal comparisons show changes in kex while vertical comparisons show changes in pES. Different spin-lock amplitudes are denoted by colors. Dotted lines correspond to cases where the decay of the magnetization is not mono-exponential. Solid gray vertical lines correspond to an offset of –Δω, while the yellow star denotes a typical Watson-Crick to Hoogsteen exchange scenario in DNA[115]. Simulations assumed the following parameters: , γ(1H)B0/2π = 700 MHz, R1,GS = R1,ES = 2.5 s −1 and R2,GS = R2,ES = = 22.5 s−1. The initial alignment of the magnetization was performed as described in Section 6.1.

