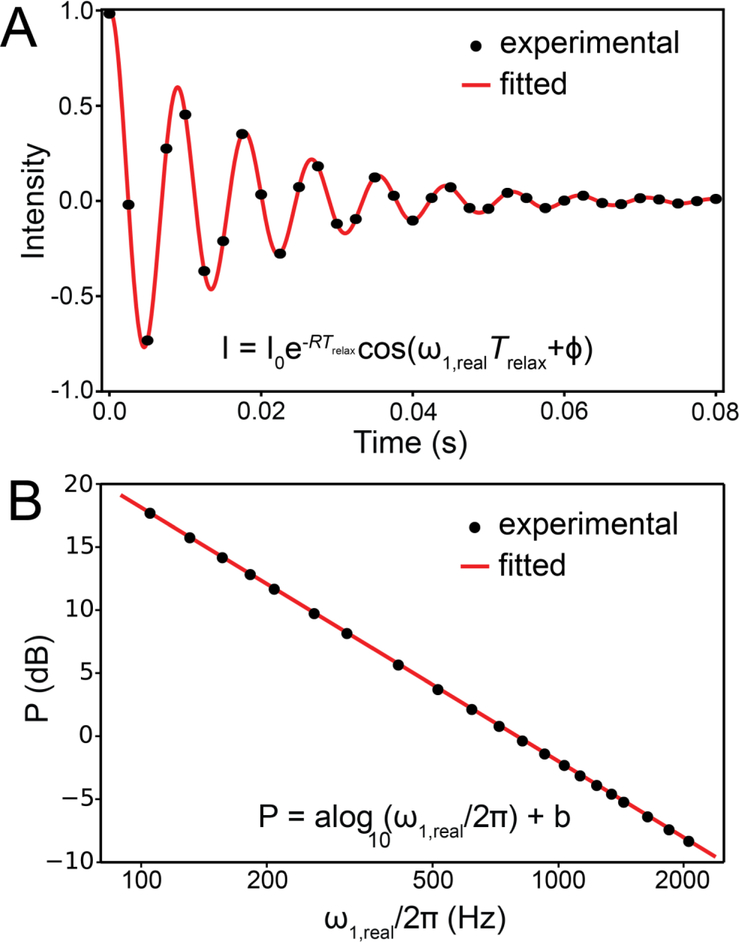
Figure 30.
Calibration of the spin-lock amplitude in R1ρ experiments. A) Nutation curve showing variation of signal intensity (black dots) as a function of time during an R1ρ calibration experiment. The red line is a fit of the intensity to the equation in the inset. B) Variation of the actual spin-lock frequency ω1,real, with the power P of the spin-lock field, obtained by fitting nutation curves in part (A) (black dots). The red line denotes a fit to the equation in the inset.

