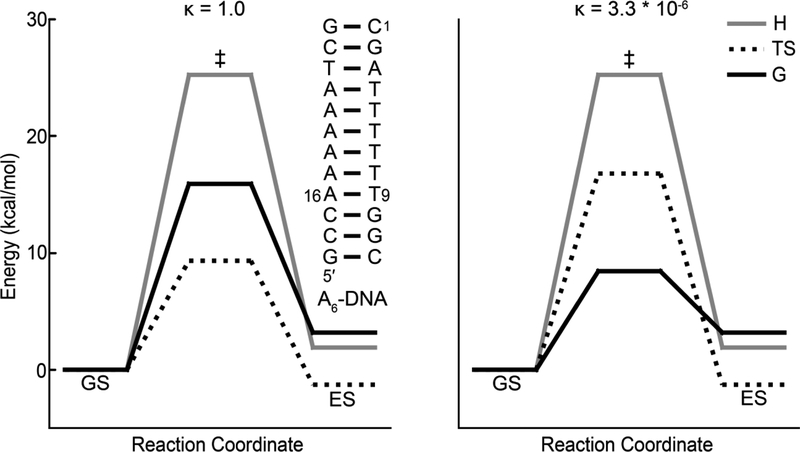
Figure 33.
Thermodynamics and kinetics of GS-ES exchange characterized using temperature dependent R1ρ RD measurements. Free energy diagram (1 kcal/mol = 4.184 kJ/mol) for the Watson-Crick to Hoogsteen transition (κ = 1, left and κ = 3.3 * 10−6, right) for A16-T9 in A6-DNA at pH 5.4, 25 °C obtained using off-resonance R1ρ RD, as reported by Al-Hashimi et al.[17]. The secondary structure of A6-DNA is shown in inset.

