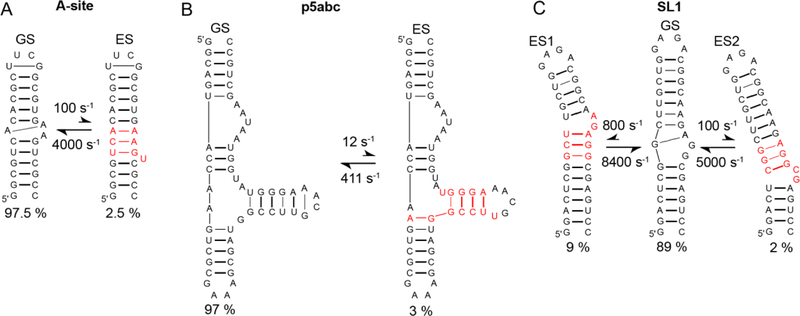
Figure 39.
RNA ESs feature localized changes in secondary structure. Shown are the secondary structures of ES determined for A) bacterial A-site, B) p5abc and C) HIV-SL1 using selective 1D R1ρ RD measurements. The part of the ES undergoing structural changes on transforming from the GS is indicated in red. Thick lines correspond to Watson-Crick BPs and G-U mismatches, whereas thin lines denote other non-canonical mispairing. The populations of the states and the rate constants for GS-ES exchange, as obtained using R1ρ RD measurements[9, 16] are also shown.

