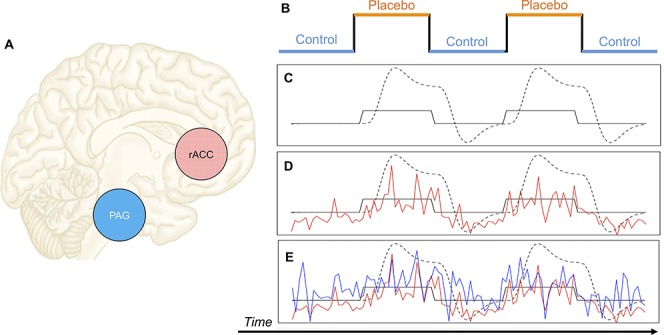
Figure 1.

Psychophysiological interaction. Here we present a cartoon example of how PPI can be used to measure task-based changes in connectivity. A) PPI has been used to measure placebo-induced changes in connectivity between the rACC and PAG11. In PPI analysis, a variable that represents 2 levels of an experimental condition (B) is convolved with a canonical hemodynamic response function (the dotted line in C). Then, the time series of the BOLD signal of an ROI is extracted (eg, the red time series in D could represent the time series of the rACC), which will correspond roughly to the onsets of the experimental condition if that ROI is responsive to the experimental condition. Finally, those 2 time series are multiplied together to create a time series that can be used to predict activity in other brain regions (eg, the time series of the PAG, represented by the blue time series in E). Regions of interest whose time series correlate with the red time series in D can be said to exhibit FC with the ROI that generated the red time series, and if the correlation varies as a function of experimental condition (eg, is enhanced under placebo, relative to control), then FC is associated with experimental condition. Adapted from Ref. 95. FC, functional connectivity; PAG, periaqueductal gray; PPI, psychophysiological interactions; rACC, rostral anterior cingulate cortex; ROI, region of interest.
