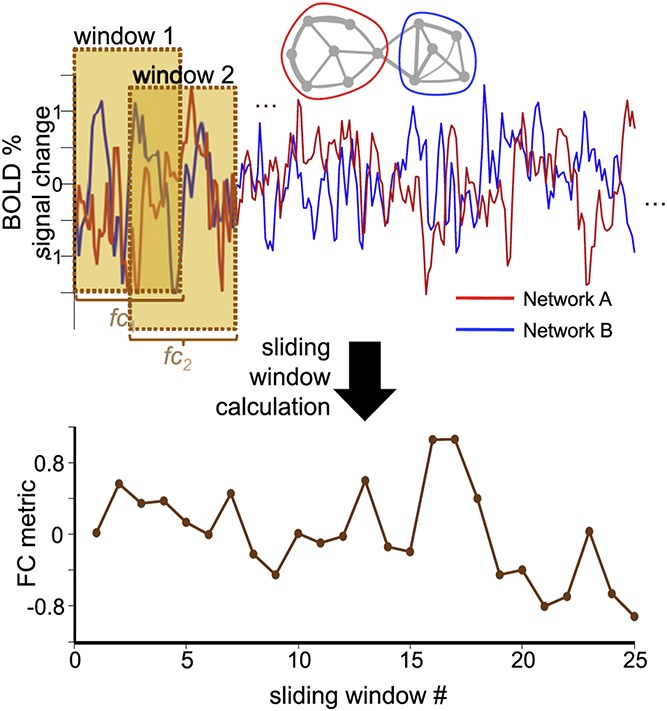
Figure 4.

Sliding-window analysis of dynamic functional connectivity in resting-state fMRI. In sliding-window analyses, the BOLD time series from 2 distinct regions or networks are extracted, and then the correlation between the time series over a set “window” of time is computed as a metric of FC, a process that is repeated for N windows (in this case, N = 25) to determine the time series of FC. Reproduced with permission from Ref. 63. FC, functional connectivity; fMRI, functional magnetic resonance imaging.
