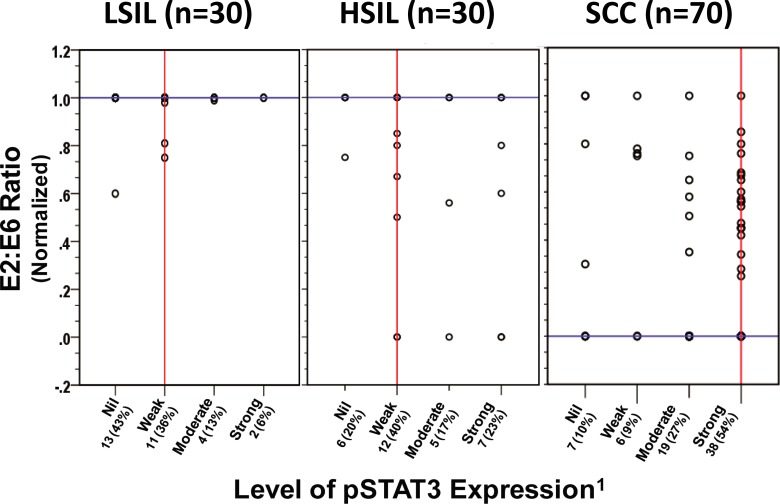
Fig 3. Analysis of the physical state of HPV16 genome and level of active pSTAT3(Y705) in cervical pre-cancer and cancer cases.
Distribution of normalized HPV16 E2: E6 ratio and level of pSTAT3 expression in cervical pre-cancer (LSIL and HSIL) and cancer cases (SCC). Each circle indicates an individual case. Normalized E2: E6 ratios were determined by PCR and calculated as described in Methods. Normalized E2: E6 ratio = 0 represents predominantly integrated HPV16 genome, value = 1 represents predominantly episomal viral genome, and values between 0 and 1 indicate a mixed form of HPV16 genome. 1Arbitrary level of pSTAT3 expression in immunoblotting: Strong = (+++), Moderate = (++), Weak = (+), Nil/undetectable = (-). The vertical red line and horizontal blue line represent median values of pSTAT3 expression and E2: E6 ratio in each disease group, respectively.

