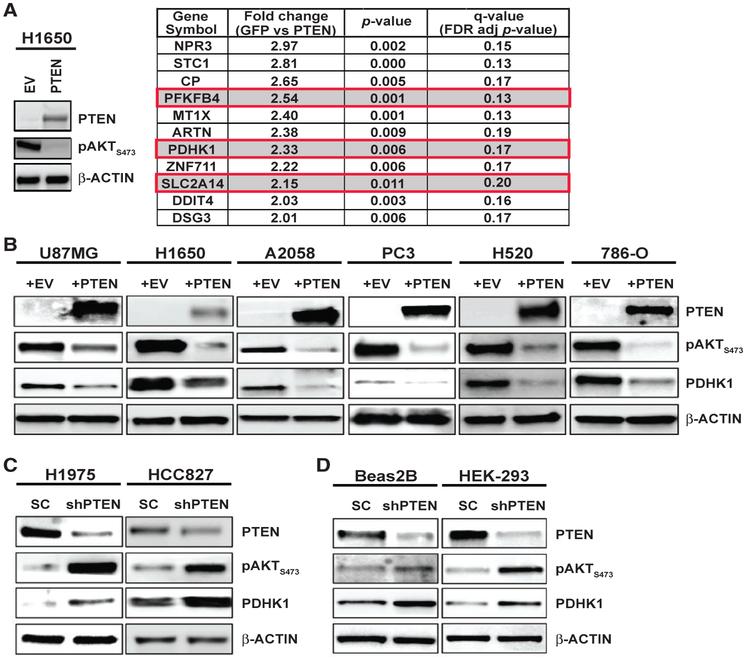
Figure 1. PTEN Loss or Inactivation Upregulates PDHK1 in Cancer and Normal Cells.
(A) Left: western blots showing PTEN and phospho-AKT expression in PTEN-deficient H1650 cancer cells stably expressing PTEN or empty vector (EV). Right: list of genes significantly upregulated (fold change > 2, multiple t tests, *p < 0.05, q < 0.2, n = 3 replicates) in GFP-expressing H1650 cells compared with H1650 cells stably re-expressing PTEN, by microarray analysis. Highlighted in red boxes are the top upregulated energy metabolism genes, including PDHK1, in H1650-GFP cells.
(B) Western blots showing PTEN, phospho-AKT, and PDHK1 expression in PTEN-deficient cancer cell lines stably expressing PTEN or empty vector (EV). (C and D) Same as (B) in PTEN-proficient cancer (C) or normal (non-cancer) (D) cell lines with stable PTEN knockdown. shPTEN, shRNA to PTEN; SC, scrambled control shRNA.

