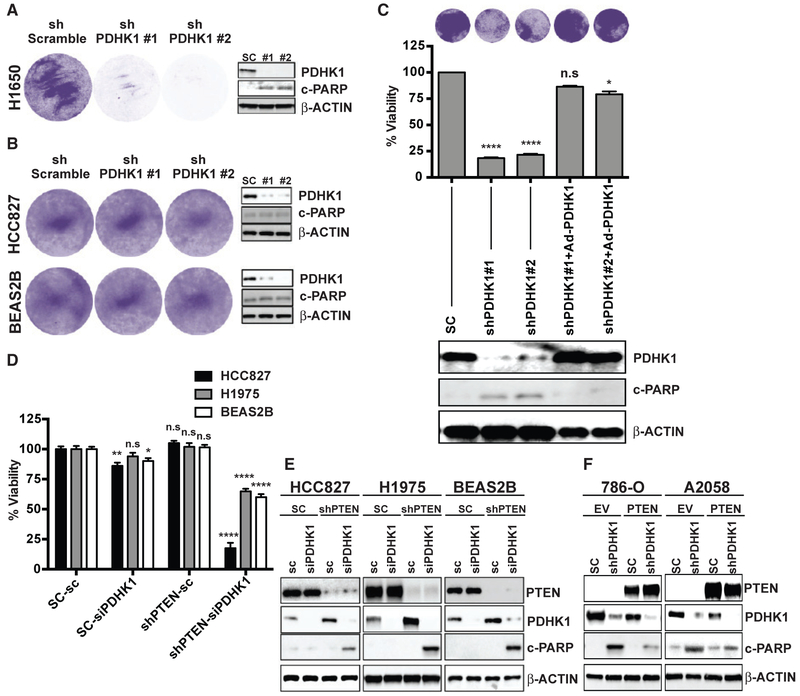
Figure 2. PTEN Loss or Inactivation Induces Cellular Dependence on PDHK1 for Survival.
(A and B) Effects of stable PDHK1 knockdown in PTEN-deficient cancer (H1650) (A) or PTEN-proficient cancer (HCC827) and normal (Beas2B) cell lines (B) on cell growth by crystal violet staining assay (left) and apoptosis induction as measured by cleaved PARP levels by immunoblot analysis (right) are shown. shPDHK1#1 and shPDHK1#2, shRNAs to PDHK1; shScramble, scrambled control shRNA.
(C) Effects of stable PDHK1 knockdown and adenovirus-based shRNA resistant PDHK1 re-expression in PTEN-deficient H1650 cancer cells on cell growth by crystal violet staining assay (top) or CellTiter-Glo luminescent assay (middle) and apoptosis induction as measured by cleaved PARP levels by immunoblot analysis (bottom) are shown. shPDHK1#1 and shPDHK1#2, shRNAs to PDHK1; SC, scrambled control shRNA. Data are shown as mean ± SEM (n = 8 replicates). *p < 0.05 and ****p < 0.0001; n.s., not significant compared with “scrambled control shRNA expressing PTEN-deficient cells” by Dunn’s multiple-comparisons one-way ANOVA.
(D and E) Effects of transient PDHK1 knockdown in PTEN-proficient cancer and normal cell lines with or without stable PTEN knockdown on cell viability by crystal violet staining assay (D) and apoptosis induction as measured by cleaved PARP levels by immunoblotting (E) are shown. siPDHK1, PDHK1 specific small interfering RNAs; sc, scrambled control siRNA; shPTEN, shRNA to PTEN; SC, scrambled control shRNA. Data are shown as mean ± SEM (n = 4 replicates). *p < 0.05, **p < 0.01, and ****p < 0.0001; n.s., not significant compared with “scrambled control siRNA and shRNA expressing PTEN-proficient cells” by Tukey’s multiple-comparisons one-way ANOVA.
(F) Effects of stable PDHK1 knockdown in PTEN-deficient cancer cell lines stably expressing PTEN or empty vector (EV) on apoptosis induction as measured by cleaved PARP levels by immunoblotting are shown. shPDHK1, shRNA to PDHK1; SC, scrambled control shRNA. See also Figures S3–S6.

