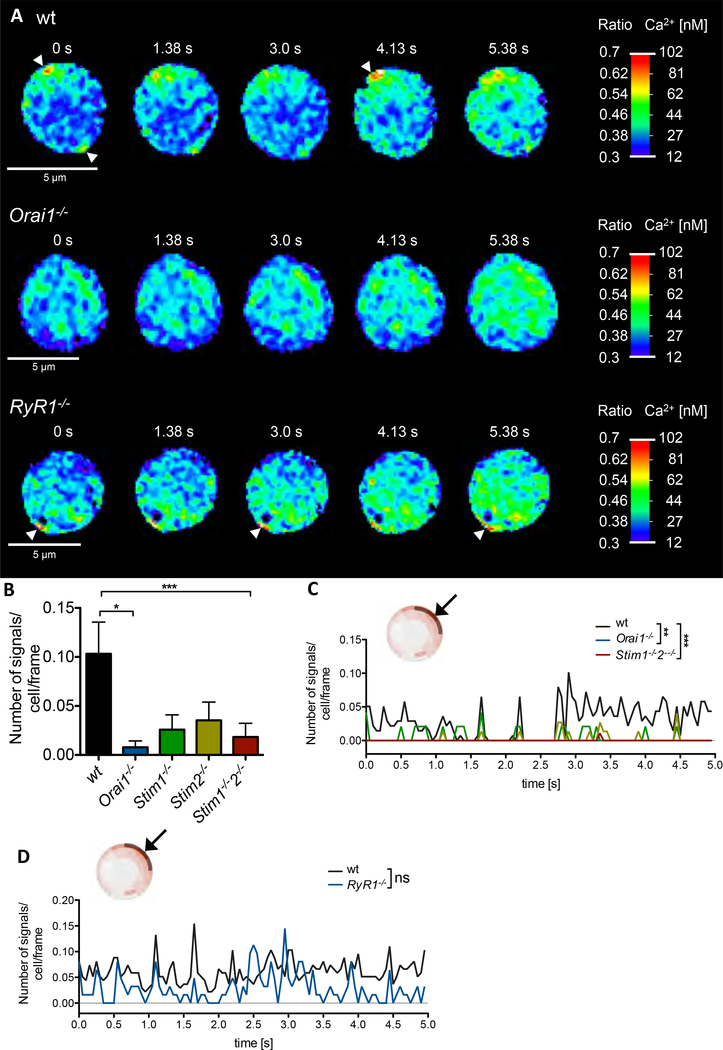
Fig. 1. Spontaneous Ca2+ microdomains in non-stimulated T cells are dependent on expression of ORAI1 and STIM1/2.
(A) Ca2+ microdomains in a non-stimulated wt T cell (top), Orai1−/− T cell (middle) and Ryr1−/− T cell (bottom). Arrow heads indicate Ca2+ microdomains directly at the PM. (B) Characteristics of Ca2+ microdomains in primary murine wt (n=69), Orai1−/− (n=28), Stim1−/− (n=24), Stim2−/− (n=39) and Stim1-/−2−/− (n=46) in a 5s time period. Comparison of the number of signals per cell and frame (data represent mean ± SEM). Statistically significant differences are marked by asterisks (* p<0.05, ** p<0.01, *** p<0.001, Kruskal-Wallis Test). (C, D) Kinetic analysis of the 5s time period. Statistical analysis was performed with wt against all other genotypes (as indicated) with Mann-Whitney-U-Test across all time points (**p<0.005, ***p<0.001).

