Figure 2.

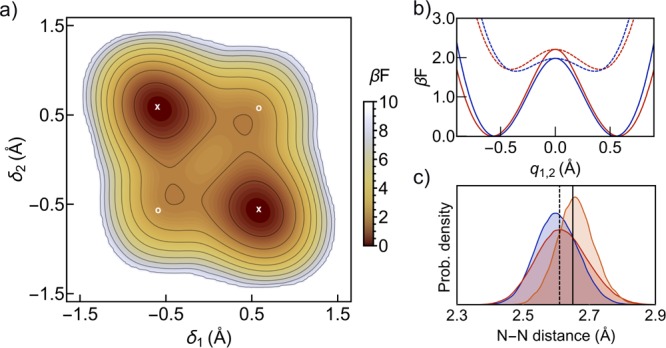
(a) Effective free energy profile of the porphycene molecule obtained from PIMD simulations at 290 K, projected on the δ1 and δ2 coordinates. The contour lines start at 0.75 kBT and are separated by 1 kBT. The x and o symbols mark the position of the trans and cis conformers, respectively, when optimized at the potential energy surface. We define “cis-like” conformations as those lying in the vicinity of (δ1, δ2) equal to (+0.4, +0.4) or (−0.4, −0.4). (b) Effective free energy projections along the q1 (δ1 = −δ2) (solid lines) and q2 (δ1 = δ2) (dashed lines) directions. Red and blue lines correspond to PIMD simulations at 290 and 100 K, respectively. (c) Nitrogen–nitrogen distance probability density obtained from PIMD simulations at 100 K (blue), PIMD simulations at 290 K (red), and MD simulation at 290 K (orange). Vertical lines indicate the minimum energy geometry values for the trans isomer (solid) and cis isomer (dashed).
