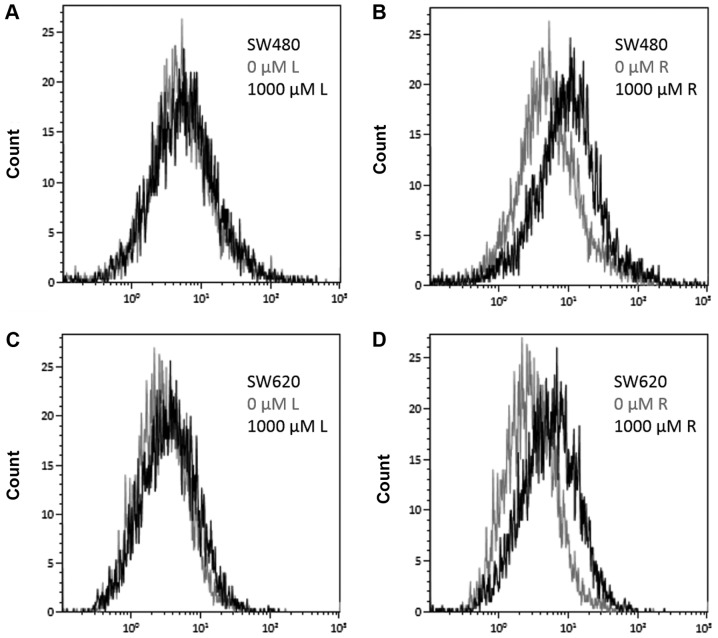
Figure 4.
Change in cell proliferation measured by PKH67 presented in overlays. The data are presented as an overlay histogram of PKH67 median fluorescence intensity compared with the drug-free control (0 µM) and 1,000 µM L or R. (A) Overlay of PKH67 median fluorescence intensity for SW480 cells comparing drug-free control (light grey) and 1,000 µM L (black). (B) Overlay of PKH67 median fluorescence intensity for SW480 cells comparing drug free control (light grey) and 1,000 µM R (black). (C) Overlay of PKH67 median fluorescence intensity for SW620 cells comparing drug-free control (light grey) and 1,000 µM L (black). (D) Overlay of PKH67 median fluorescence intensity for SW620 cells comparing drug free control (light grey) and 1,000 µM R (black). L, lidocaine; R, ropivacaine.

