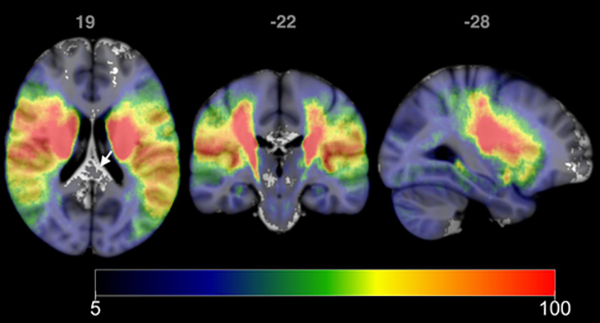
Figure 4:
Incidence maps for 2763 patients. Each voxel represents the number of patients with lesions involving that voxel. Maximum incidence was 295, with incidence shown using the range 5 to 100. Voxels for which less than 5 patients had lesions at that location do not have an overlaid colormap (see arrow). Images are shown in radiological format.

