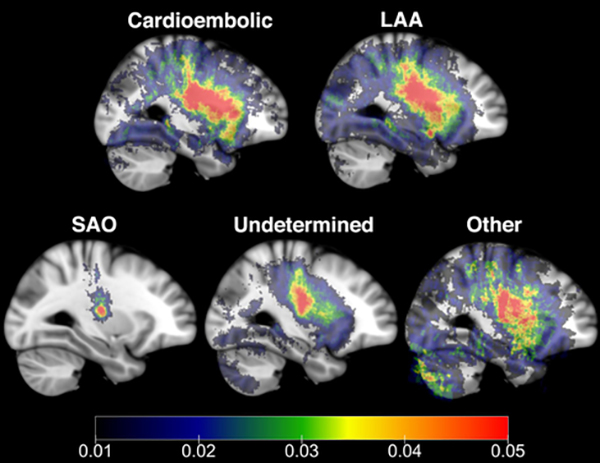
Figure 5:
Frequency maps (incidence map/number of subjects) showing topographical distribution of infarcts across different stroke subtypes – cardioembolic (N=425), LAA (N=597), SAO (N=431), Other (N=200), and Undetermined (N=1110). SAO frequency map had the lowest correlation compared with the other subtypes, followed by Other. Images are shown in radiological format.

