Figure 1. Two biochemically distinct sEV sub-populations are released by MDA-MB-231 cells.
(a) Schematic showing the two-step purification methodology. Differential ultracentrifugation was followed by buoyant density flotation in a linear iodixanol gradient (Figure 1—figure supplement 1). (b) Immunoblot across the iodixanol gradient for classical sEV markers as well as other non-vesicular RNP components. The two discrete sub-populations are indicated. CD63, a glycosylated protein, migrates heterogeneously. (c) Quantification of individual proteins as in 1b. The black line delineates the maximum signal across the gradient showing three distinctive areas. The first, second and third peak represent the vLD, vHD and non-vesicular RNP fractions. (d) Nanoparticle tracking analysis showing the size distribution of the vHD and vLD sub-populations. The high-speed pellet is also shown. (d) Quantification of the particle number per sEV sub-population using Nanoparticle tracking analysis. Data plotted are from two independent experiments; error bars represent standard deviation from independent samples. (e) Bioanalyzer analysis of the vHD and vLD RNA. The high-speed pellet RNA is also shown.

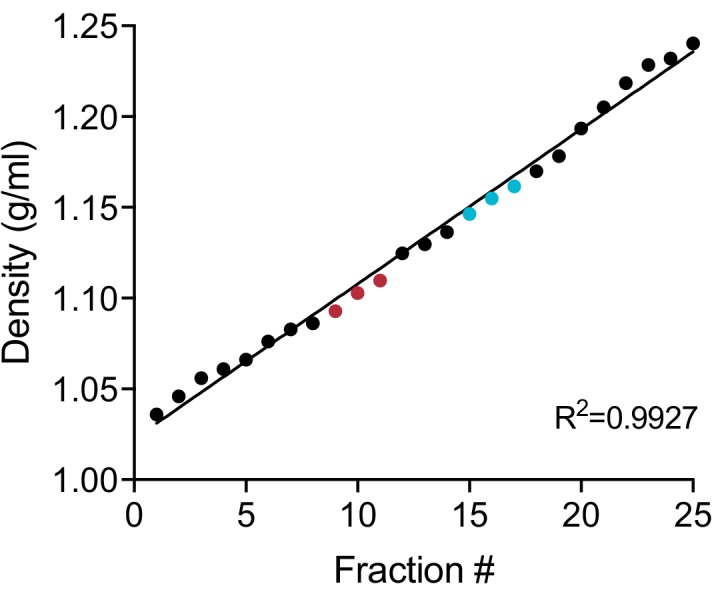
Figure 1—figure supplement 1. Linearity of iodixanol density gradient.