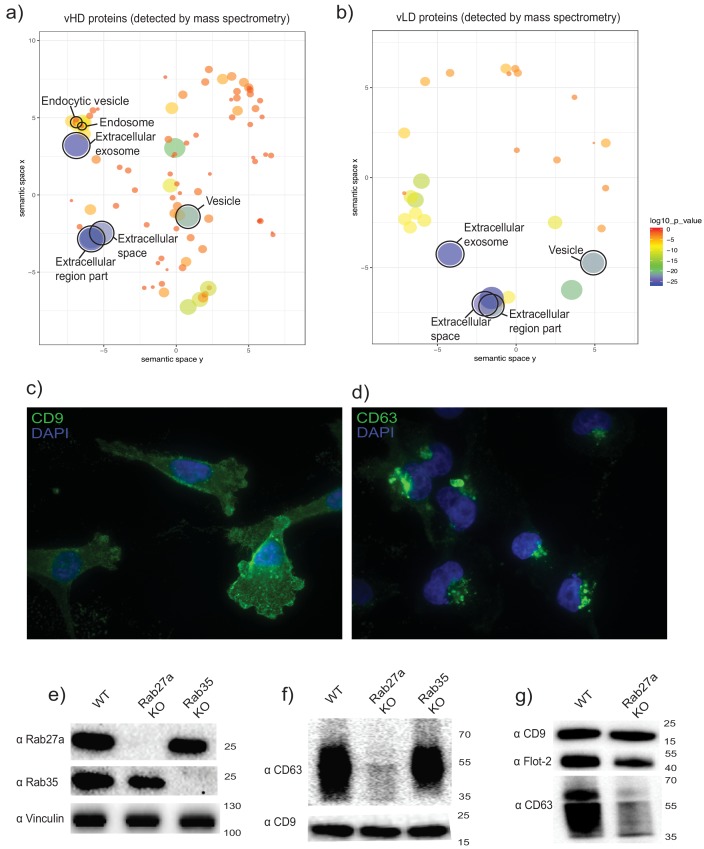
Figure 2. The two biochemically distinct sEV sub-populations co-fractionate with membranes of different sub-cellular origin.
(a, b) Gene ontology analysis for sub-cellular localization of proteins that coincide with vHD and vLD proteins detected by mass spectrometry. The gene ontology analysis platform compares the list of proteins given per group to the human genome frequency. The detection of enrichment for a certain organelle/localization is represented as circles, with the size of circles correlating to log10 p-value. (c, d) Immunofluorescence for two tetraspanins enriched in each sEV sub-population. CD9 and CD63 enriched in vLD and vHD respectively. (e) Analysis of WT, CRISPR-Cas9 Rab27a KO and CRISPR-Cas9 Rab35 KO by immunoblot. Rab27a, Rab35 and vinculin are shown. (f) Immunoblots for CD63 and CD9 in sEVs secreted by WT, Rab27a KO cells and Rab35 KO cells. The amounts of loaded sEVs were normalized by total cell number. (g) Immunoblots for CD63, CD9 and flotillin-2 in sEVs secreted by WT and Rab27a KO cells. The amounts of loaded sEVs were normalized by total cell number.

