. 2019 Aug 22;8:e47544. doi: 10.7554/eLife.47544

Figure 3. MicroRNA profiling of high buoyant density and low buoyant density sEV sub-populations.

(a, b) Scatterplots showing the relative abundance (as arbitrary units of fluorescence (AUF)) for miRNAs detected in vHD and vLD sub-populations relative to cellular levels, as detected by Firefly profiling and normalized per ng of total RNA. In blue, vHD miRNAs that were selected for further validation by RT-qPCR. Circled miRNAs in vLD represent those also found to be enriched in the vHD-subpopulation. (c, d) Log2 fold change for top vHD and vLD candidate miRNAs in vHD or vLD relative to cells (vHD/CL or vLD/CL, respectively) and vHD relative to vLD or vice versa (vHD/vLD or vLD/vHD, respectively). MiRNA species were quantified by RT-qPCR and normalized per ng of total RNA. Data plotted for miR-122 are from three independent experiments (biological replicates), each independent experiment with triplicate qPCR reactions; error bars represent standard deviation from independent samples. (e) Scatterplots showing relative abundance of miRNAs (AUF) detected in vHD and vLD sub-populations normalized per ng of total RNA, as detected by Firefly profiling. (f) RNase protection of highly enriched vHD miRNAs quantified by qPCR. Isolated sEVs were treated with or without RNase If and or Triton X-100. Data plotted are from two independent experiments, each independent experiment with triplicate qPCR reactions; error bars represent standard deviation from independent samples. Statistical significance was performed using Student’s t-test (**p<0.01, ***p<0.001, ns = not significant). CL: cellular lysate. Dashed red lines in a, b and e, represent 10-fold differences.

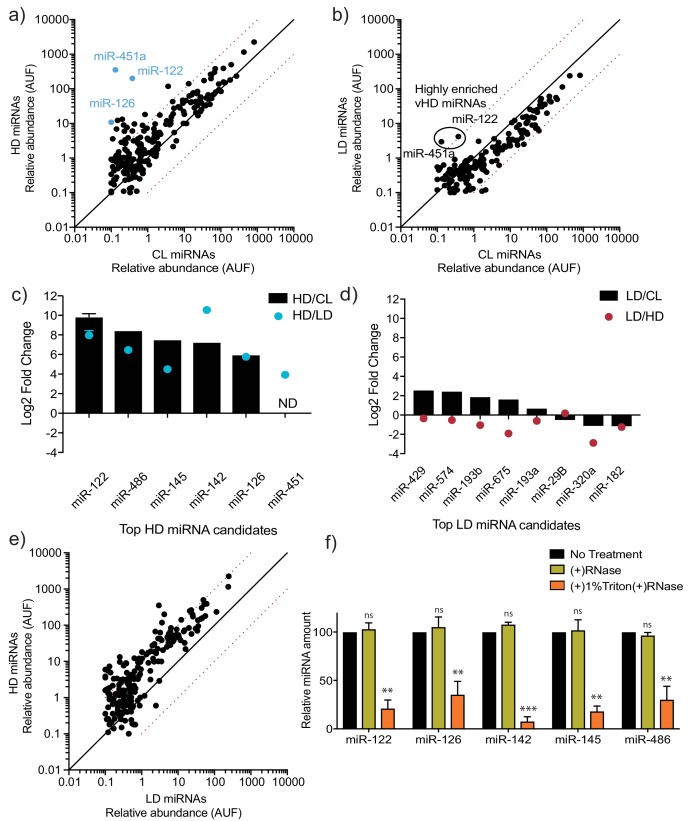
Figure 3.

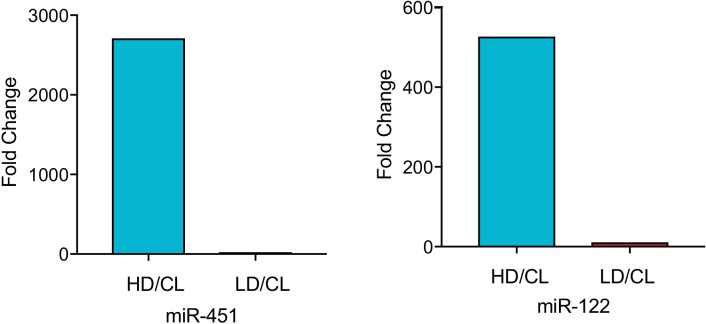
Figure 3—figure supplement 1. MiR-122 and miR-451 are highly enriched in the vHD sub-population.

Figure 3—figure supplement 1.

Fold difference vHD/CL or vLD/CL for miR-451a and miR-122. Data extracted from Firefly profiling. CL: cellular lysate.
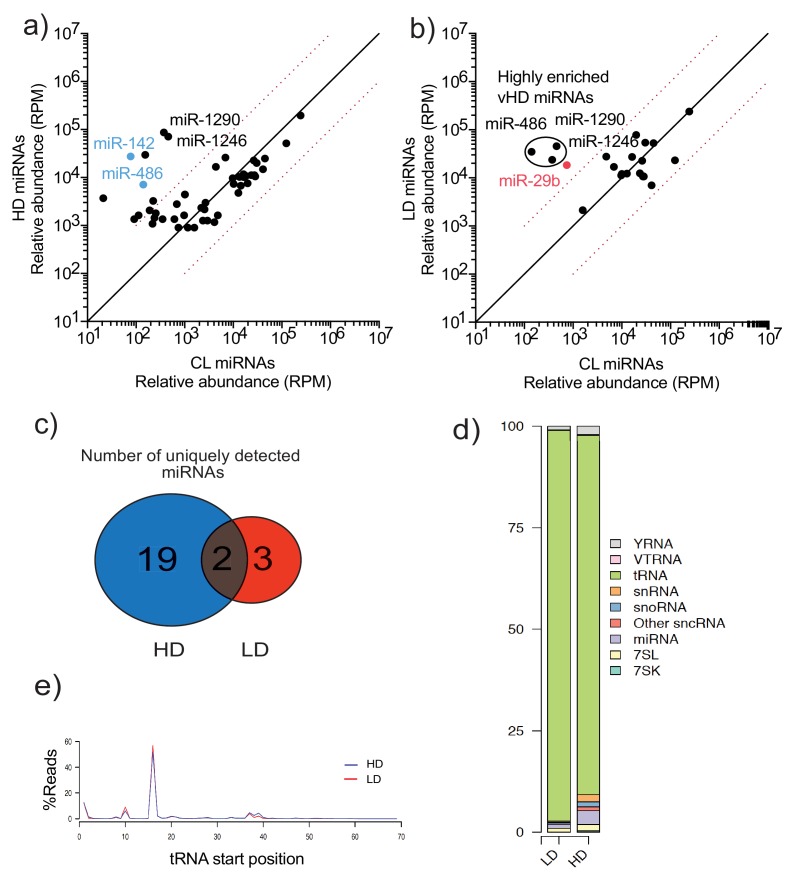
Figure 3—figure supplement 2. TGIRT-sequencing of high buoyant density and low buoyant density sEV sub-populations.

Figure 3—figure supplement 2.

(a, b) Scatterplots showing the relative abundance (as reads per million (RPM)) for miRNAs detected in vHD and vLD sub-populations relative to CL levels. Normalized per total number of miRNA reads. In blue, vHD miRNAs that were selected for further validation by qPCR. In red, vLD miRNAs selected for further validation by qPCR. Circled miRNAs in vLD represent those also found to be enriched in the vHD-subpopulation c) Venn Diagram showing the total number of vHD and vLD uniquely found miRNAs (miRNAs with non-detectable signal in cellular lysates) detected by TGIRT-seq. (d) Bar graph showing the distribution of all small non-coding RNA transcripts found in vHD and vLD sub-populations. (e) tRNA start site distribution showing the majority of tRNA reads start at position 16, previously described as the site of an EV-specific D-loop modification (Shurtleff et al., 2017). The putative D-loop modification is present at relatively same levels in both the vHD and vLD sub-populations. CL: cellular lysate. Dashed red lines in a and b represent 10-fold differences.
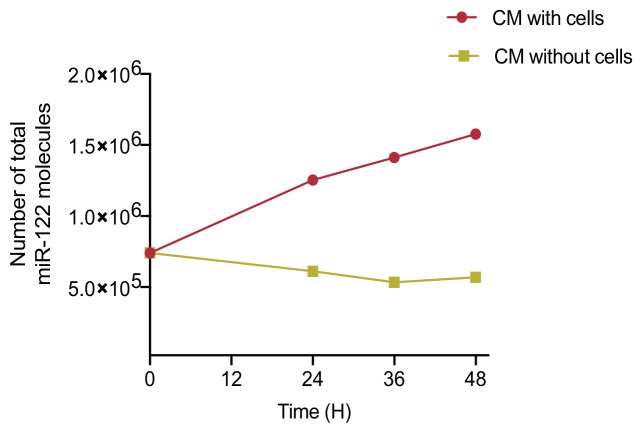
Figure 3—figure supplement 3. MiR-122 accumulates in conditioned media (CM) over time.

Figure 3—figure supplement 3.

Quantification of total number of miR-122 molecules in CM. CM was incubated with or without MDA-MB-231 cells for a period of 48 hr. Samples were collected at the indicated time points. Cell debris and apoptotic bodies were removed by low and medium speed centrifugation (as in steps 1–2 shown in Figure 1a).
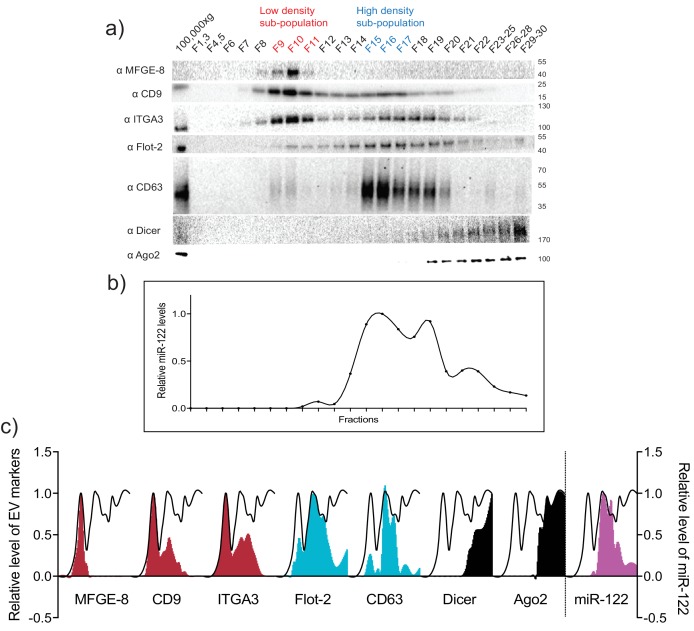
Figure 3—figure supplement 4. MiR-122 co-fractionates with the vHD sub-population.

Figure 3—figure supplement 4.

(a) Iodixanol linear gradient showing the distribution of EV and non-vesicular RNP markers. (b) Quantification of miR-122 by qPCR across the linear gradient. The majority of MiR-122 co-fractionates with the vHD subpopulation. (c) Quantification of individual proteins as in a and miR-122 as in b across the gradient. The black line delineates the maximum signal across the gradient showing the three distinct components. The first, second and third peak represent the vLD, vHD and non-vesicular RNP fractions.