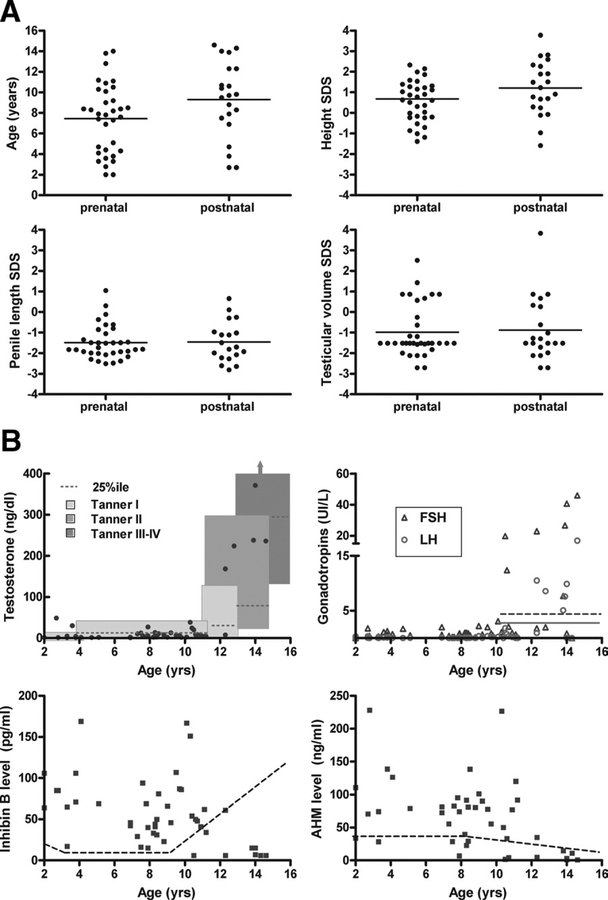
Figure 1.
A, Features by timing of diagnosis of KS: prenatal versus postnatal. The mean is indicated by the horizontal line in each group, age, height SDS, penile length SDS, and testicular volume SDS. B, Hormones in boys with KS in relationship to age. Testosterone values6: the boxes m ark the normal values for age and Tanner stage. G onadotropins6: upper threshold of norm al LH level during puberty marked by solid line, and for FSH marked by dotted line. Inhibin B levels: lower threshold of normal marked by dotted line. AMH levels: lower threshold of normal marked by dotted line.

