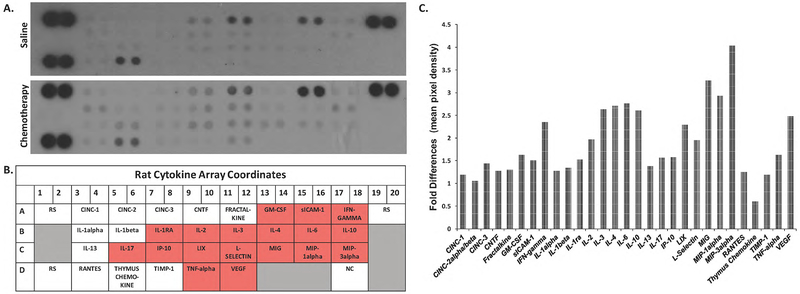
Fig. 1:
Cytokine and chemokine production was evaluated using Proteome Profiler arrays (R&D Systems) as described in Materials and Methods. a) Representative cytokine panel of protein lysates prepared from the hippocampus of saline or AC chemotherapy-treated rats (n=6). Membranes shown are from a 10-minute exposure to x-ray film. b) Cytokine/chemokine array duplicate spot coordinates (red: >1.5- fold upregulation in protein expression compared to saline-control). RS, reference spots; NC, negative controls. c) Densitometric analyses of the antibody arrays. The mean pixel density of the cytokine/chemokine spots was divided by the mean pixel density of the reference spots for each membrane. The column graphs display the fold changes of AC chemotherapy groups compared to saline controls.

