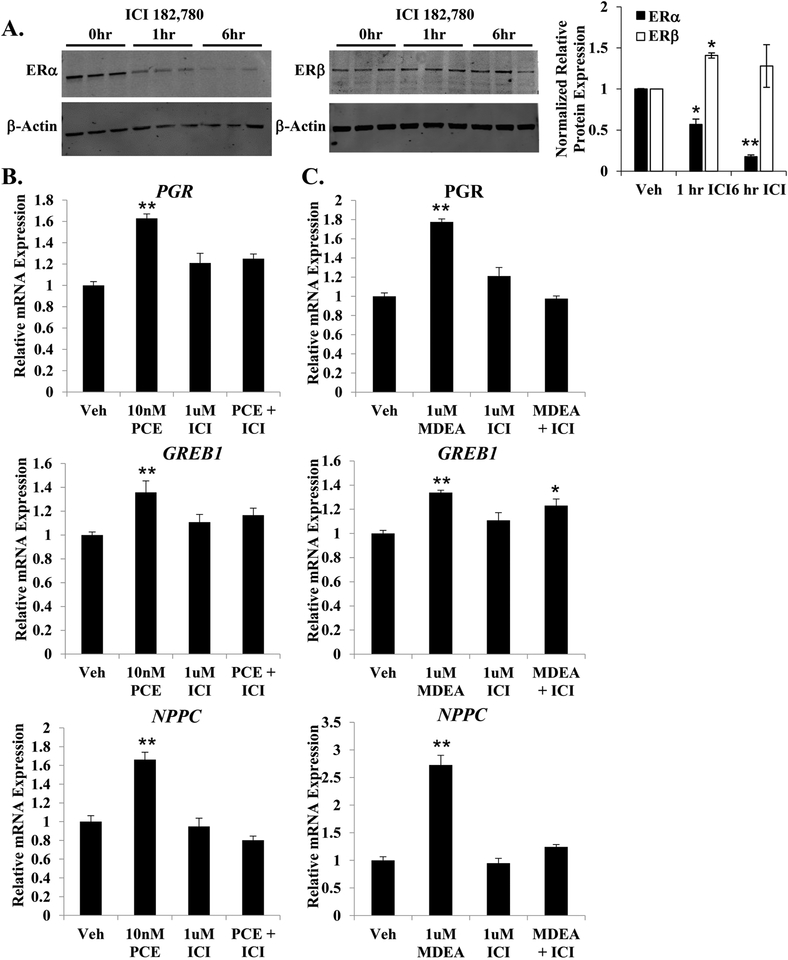
FIGURE 8. PCE and MDEA signaling and ERα.
(A) Representative immunoblot of ERα and ERβ expression levels in Ishikawa cells treated for 0, 1, or 6 hr with 1 μM ICI 182,780. Data represent mean ± SEM from 3 independent experiments. Expression of β-actin was utilized as a loading control. (B) Expression of the progesterone receptor (PGR), growth regulation by estrogen in breast cancer 1 (GREB1), and natriuretic peptide C (NPPC) mRNA were evaluated by qRT-PCR in Ishikawa cells treated for 6 hr with 10 nM PCE or 1 μM MDEA with or without pretreatment with 1 μM ICI 182,780. Values were normalized to the reference gene peptidylprolyl isomerase B (PPIB) and set relative to vehicle. Bar graphs represent means of at least five biological replicates ± SEM. *p<0.05, **p<0.01 as determined by ANOVA with Tukey’s post-hoc analysis.

