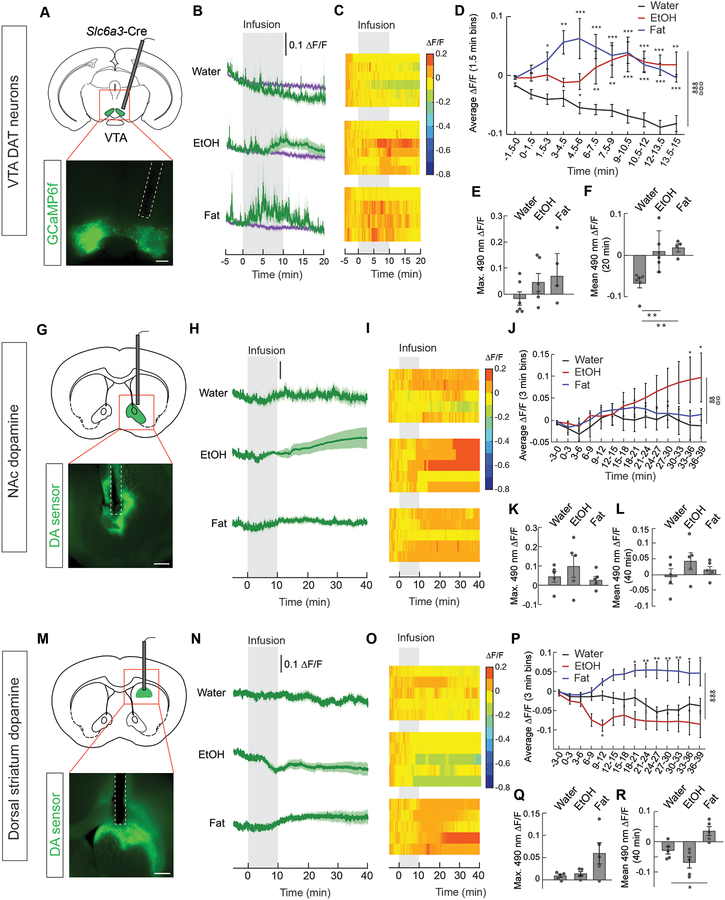
Figure 5. Nutrients and alcohol increase dopamine signaling.
(A) Schematic for monitoring calcium dynamics in dopamine neurons, and representative image of GCaMP6f in neurons expressing dopamine active transporter (Slc6a3, DAT neurons). Scale bar, 500 μm. (B) Average ΔF/F of GCaMP6f signals in DAT neurons of food-restricted mice following intragastric infusion of water (n=6), EtOH (n=6), or fat (n=4). (C) Heat maps reporting ΔF/F of the 490-nm signal of individual mice in (B). (D) Mean ΔF/F of the 490-nm signal in 90-s bins from mice infused with EtOH, fat, or water in (B) (n=4–6/group, two-way repeated measures ANOVA, p<0.001). (E) Maximum ΔF/F of the 490-nm signal following gastric infusion of mice in (B) (n=4–6/group, one-way ANOVA, p=ns). (F) Mean ΔF/F of the 490-nm signal from 0 to 20 min following gastric infusion of mice in (B) (n=4–6/group, one-way ANOVA, p<0.01). (G) Schematic for monitoring dopamine signaling in the nucleus accumbens (NAc), and representative image of neurons expressing the dopamine (DA) sensor. Scale bar, 500 μm. (H) Average ΔF/F of DA sensor in food-restricted mice following intragastric infusion of water, EtOH, or fat (n=5/group). (I) Heat maps reporting ΔF/F of the 490-nm signal of the recordings in individual mice in (H). (J) Mean ΔF/F of the 490-nm signal in 3-min bins from mice infused with EtOH, fat, or water in (H) (n=5/group, two-way repeated measures ANOVA, p<0.01). (K) Maximum ΔF/F of the 490-nm signal following gastric infusion of mice in (H) (n=5/group, one-way ANOVA, p=ns). (L) Mean ΔF/F of the 490-nm signal from 0 to 40 min following gastric infusion of mice in (H) (n=5/group, one-way ANOVA, p=ns). (M) Schematic for monitoring dopamine signaling in the dorsal striatum, and representative image of neurons expressing the dopamine (DA) sensor. Scale bar, 500 μm. (N) Average ΔF/F of DA sensor in food-restricted mice following intragastric infusion of water, EtOH, or fat (n=5/group). (O) Heat maps reporting ΔF/F of the 490-nm signal of the recordings in individual mice in (N). (P) Mean ΔF/F of the 490-nm signal in 3-min bins from mice infused with EtOH, fat, or water in (N) (n=5/group, two-way repeated measures ANOVA, p<0.001). (Q) Maximum ΔF/F of the 490-nm signal following gastric infusion of mice in (N) (n=5/group, one-way ANOVA, p=ns). (R) Mean ΔF/F of the 490-nm signal from 0 to 40 min following gastric infusion of mice in (N) (n=5/group, one-way ANOVA, p<0.05). Data are expressed as mean ± SEM, ns p>0.05, t-tests and post-hoc comparisons: *p<0.05, **p<0.01, ***p<0.001; ANOVA interaction: ∞∞p<0.01, ∞∞∞p<0.001; ANOVA main effect of group: ☼☼p<0.01, ☼☼☼p<0.001.

