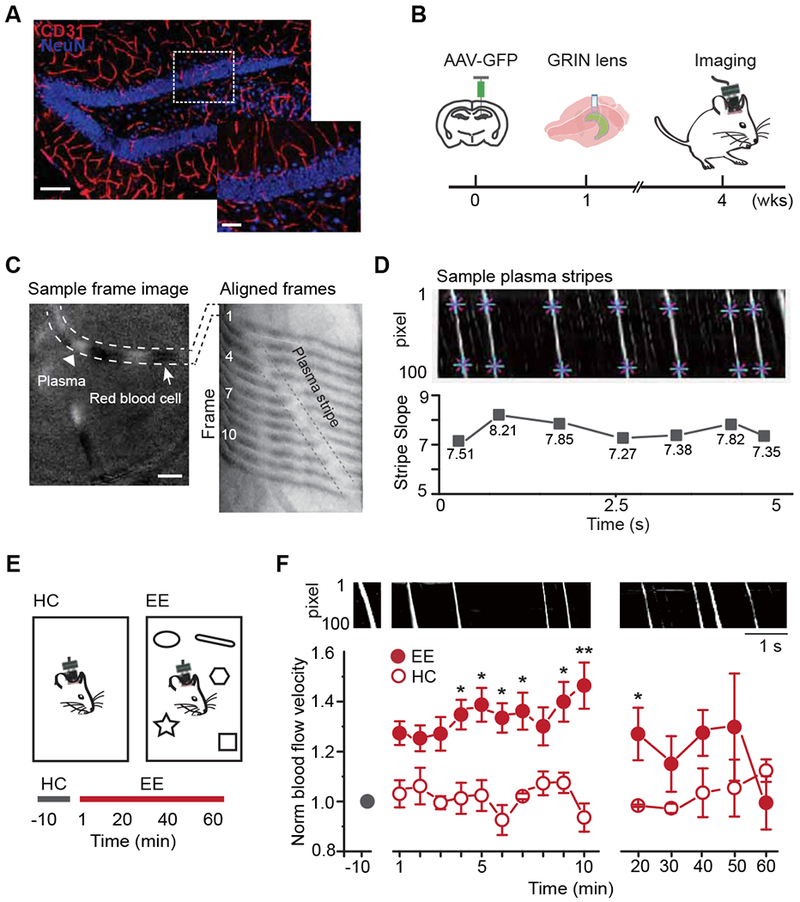
Figure 1. Hippocampus-engaged exploration augmented blood flow velocity in the dentate gyrus.

A. The vasculature in the dentate gyrus (red: CD31, blue: NeuN, scale bar: 100 μm). Right is the enlarged image of the region in the white dashed box (scale bar: 40 μm).
B. The experimental procedure and timeline.
C. Microvessels captured by the miniature microscope (left): white dashed lines highlight a microvessel that contains plasma fragments (white, arrow head) and RBC fragments (white, arrow, scale bar: 50 μm). The selected vessel from 12 consecutive frames aligned on one image to visualize the movement of plasma (right, 80 Hz capturing rate). The plasma formed a white stripe (enclosed by black dashed lines) over time.
D. Sample dynamic map (DMap). An individual white stripe represents an episode of plasma crossing the vessel (eg. C right). The slope of the white stripe represents the blood flow velocity (bottom).
E. Two imaging environments (top) and the recording timeline (bottom).
F. Exploration in EE increased blood flow velocity. DMaps in the HC and EE exploration (top). Normalized blood flow velocity (bottom) in HC (n = 3) and EE for the first 10 min (n = 8, averaged every minute) and the remaining 50 min (n = 4, recorded every 10 min); Linear mixed model for longitudinal data was used for statistical analysis. * P <0.05 and ** P < 0.05/15=0.0033 after Bonferroni adjustment.
