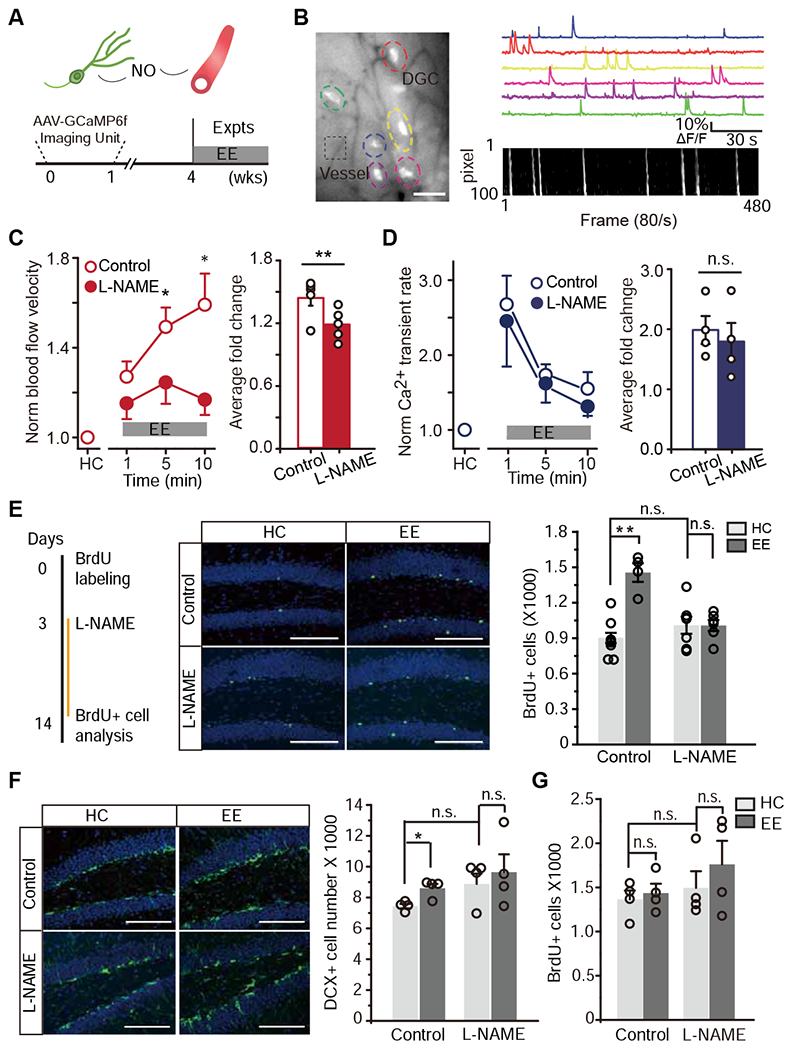
Figure 2. Suppression of the exploration-induced hyperemia dampened activity-dependent hippocampal neurogenesis.

A. Schematic model (top). The bottom is the experimental paradigm and timeline.
B. Simultaneous imaging of DGC activity and local blood flow. An imaging with GCaMP6f-labeled DGCs (colored dashed circles) and local microvessels (black dashed box) (left, scale bar: 50 μm). Ca2+ signal traces (top right) and DMap (bottom right).
C-D. Inhibition of nNOS attenuated the exploration-induced hyperemia with no detectable effect on DGC activity. C, Normalized blood flow velocity measured from mice with and without L-NAME administration during HC and EE (left, the velocity was averaged every 3 minutes, Linear mixed model for repeated measurements was used to estimate the differences at each time point. * P < 0.05 and ** P < 0.05/3 = 0.0167 after Bonferroni adjustment). The average blood flow velocity in each animal is shown for the bar plot (right, n = 5, Wilcoxon signed-rank test was performed using data from all time points, ** P < 0.01). D, Normalized Ca2+ transient rate from mice with and without L-NAME administration (Same statistical analyses as in C, n.s. P> 0.05).
E. L-NAME inhibition of nNOS abolished the experience-induced survival of newborn DGCs. The experimental timeline (left). Images of BrdU+ cells at 14 days post BrdU injection (middle, green: BrdU, blue: DAPI, scale bar: 100 μm). The quantification of the number of BrdU+ cells indicating newborn DGC survival (right, n = 8, 4, 7, 6 for each condition, Two-Way ANOVA followed by Bonferroni post hoc test, ** P < 0.01, n.s., P > 0.05).
F. Images of doublecortin (DCX)+ cells (green: DCX, blue: DAPI) at 14 days post BrdU administration (left). The quantification of average number of DCX+ cells (right, n = 4, same statistical analysis as in E, * P < 0.05, n.s., P > 0.05).
G. Quantification of the average number of BrdU+ cells in the dentate gyrus at 2 days post BrdU administration for every condition (n = 4, n.s., same statistical analysis as in E, n.s., P > 0.05).
