
Figure 3. Parvalbumin (PV) neurons mediated neurovascular coupling and promoted experience-induced hippocampal neurogenesis through NO signaling.
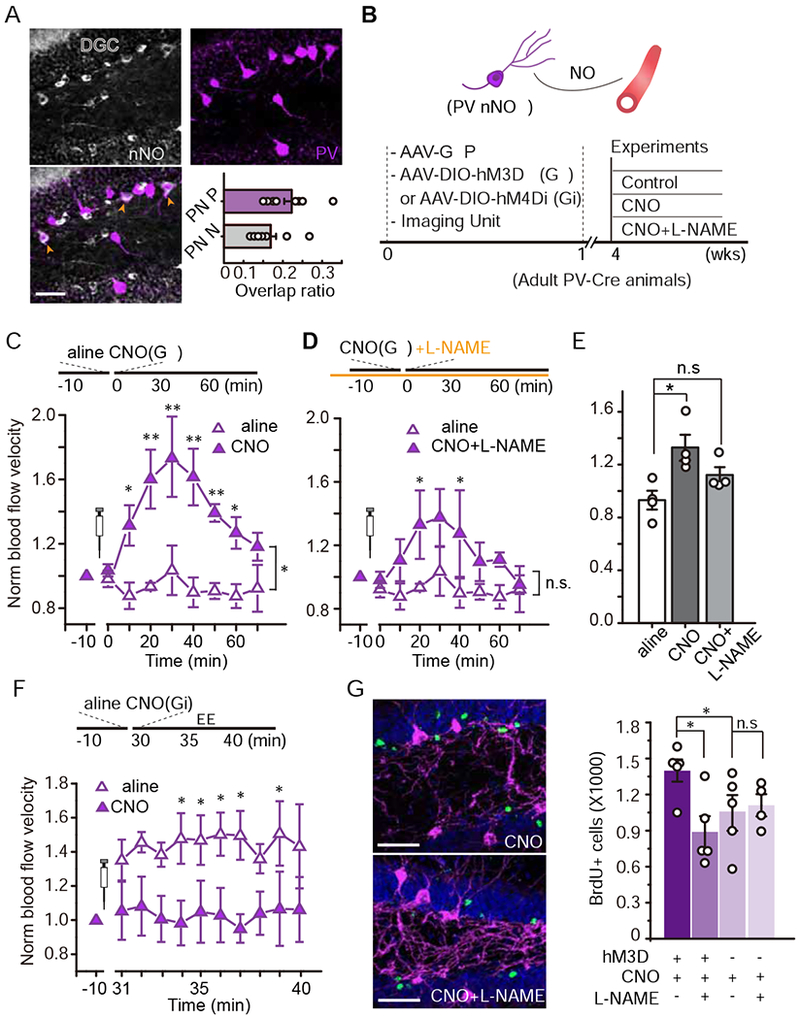
A. Images of PV (purple) and nNOS (silver) expression in the dentate gyrus. The orange arrow heads indicate cells expressing both cell markers (bottom left, scale bar: 50 μm). The ratios of PV cells expressing nNOS (PN/P) and of nNOS+ cells expressing PV (PN/N) is shown (bottom right, n = 11 brain sections).
B. The hypothetical model (top) and the associated experimental procedure (bottom).
C. Chemogenetic activation (Gq) of PV neurons in the dentate gyrus induced local functional hyperemia. Mice received saline (day 1) and CNO (day 2) while they remained in the HC (n = 4, Linear mixed model for longitudinal data was used to estimate the differences between saline and CNO. * P < 0.05, ** P <0.05/8=0.0063 after Bonferroni adjustment).
D. The same group of mice received L-NAME-containing water for 24 hr. Blood flow was recorded in the same manner as day 2 with CNO delivery to activate PV neurons (n = 4, same saline data and analysis as those in C. * P < 0.05, n.s. P > 0.05).
E. Quantification of blood flow velocity in saline, CNO, and CNO/L-NAME conditions (Mann-Whitney test, * P < 0.05, n.s., P > 0.05).
F. Chemogenetic inhibition (Gi) of PV neurons in the dentate gyrus attenuated the exploration-induced functional hyperemia (n = 4, Same analysis as those in C. * P < 0.05 after Bonferroni adjustment).
G-H. Activation of PV neurons in an nNOS-dependent manner recapitulated experience-induced neurogenesis. G, Images of BrdU+ cells (green: BrdU, purple: PV, and blue: DAPI). H, Quantification of BrdU+ cells in each experimental condition (n = 4, Two-Way ANOVA followed by Bonferroni post hoc test, *P < 0.05, n.s. P > 0.05).