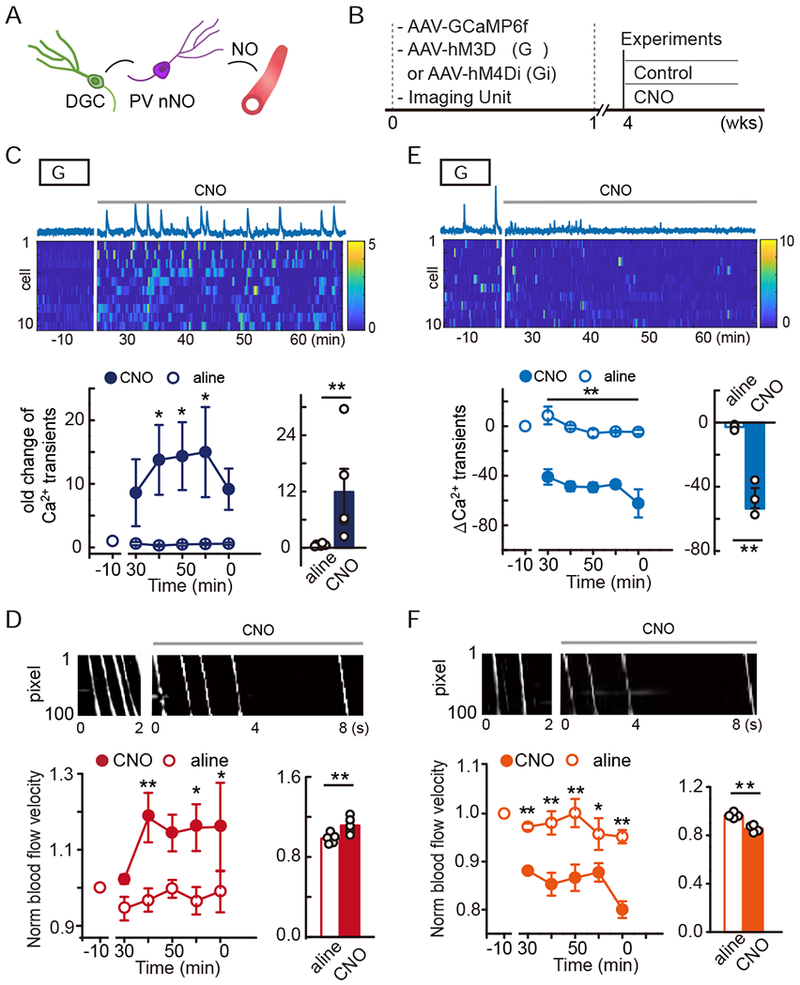
Figure 4. Bidirectional chemogenetic tuning of DGC activity altered local blood flow in the dentate gyrus.

A. The hypothetical mode.
B. Simultaneous imaging and chemogenetic manipulation of DGCs.
C-D. hM3Dq activation of DGCs. C, Ca2+ trace of a DGC and heatmap of the Ca2+ signal intensity from 10 DGCs (top, time 0 indicates CNO delivery). Quantification of DGC activity in terms of Ca2+ transient fold change (bottom, n = 5, Linear mixed model for longitudinal data was used to estimate the differences between saline and CNO. * P < 0.05; the average Ca2+ transient rate of each animal is shown for the bar plot, Wilcoxon signed-rank test was performed using data from all time points, * P < 0.05). D, Local microvascular blood flow under hM3Dq activation. Example DMap of the plasma white stripe pre- and post-CNO (top). Quantification of the blood flow velocity pre- and post-CNO (bottom, n = 5, the analyses were similar to those in C. * P < 0.05, ** P < 0.05/5 = 0.01 after Bonferroni adjustment).
E-F. hM4Di inhibition of DGCs. E, the same as C including statistical analyses but with hM4Di manipulation of DGCs (n = 3, * P < 0.05, ** P < 0.05/5 = 0.01 after Bonferroni adjustment). F, The same as D but with hM4Di manipulation (n = 4, * P < 0.05, ** P < 0.05/5 = 0.01 after Bonferroni adjustment).
