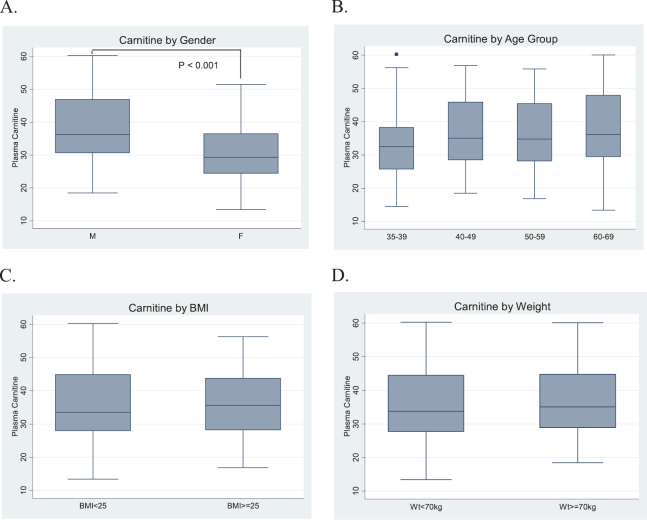
Fig. 2.
Plasma carnitine levels according to demographic factors
Fig. 2A: Plasma carnitine levels by sex.
Fig. 2B: Plasma carnitine levels by age.
Fig. 2C: BMI.
Fig. 2D: Body weight.
*The horizontal bar represents the plasma carnitine concentration (unit: μmol/L).
**The box plots indicate the medians and the inter-quartile ranges (IQR). The upper (lower) limits of the whisker plots represent the most extreme values within 1.5 IQR from the nearer quartiles (i.e., 75 percentiles or 25 percentiles).

