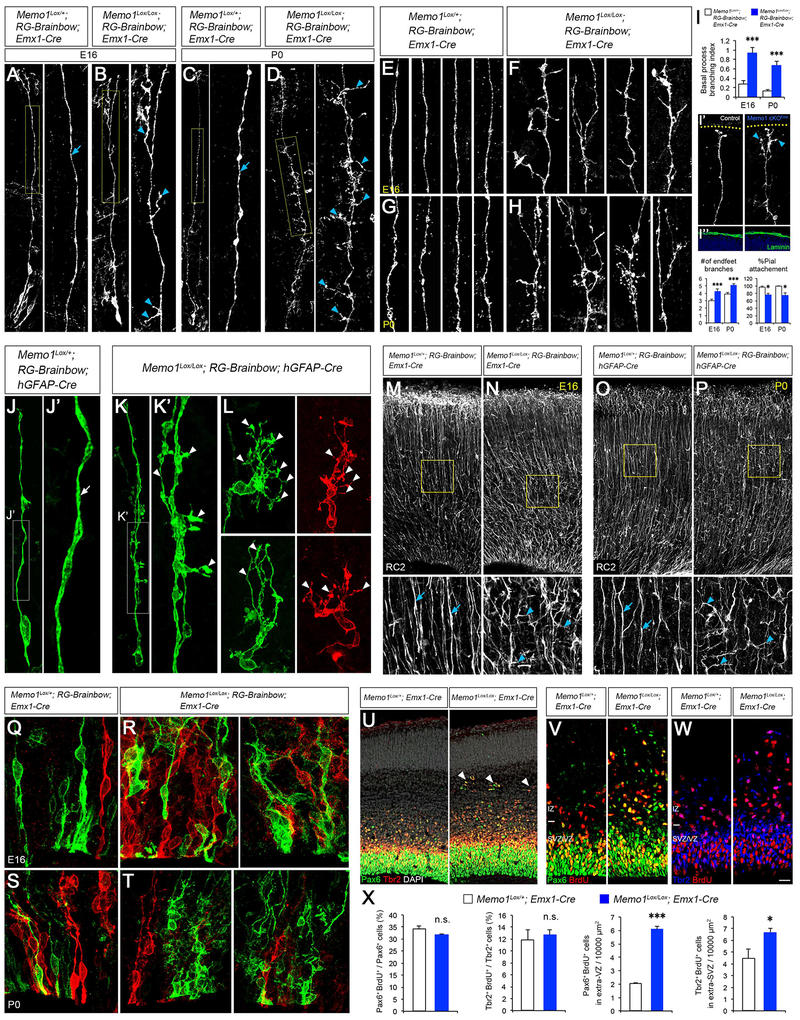
Figure 1: Disrupted organization of Memo1-deficient RGCs.
(A-D) Radial progenitor morphology in Memo1Lox/+; RG-Brainbow; Emx1-Cre (control) (A and C) and Memo1Lox/Lox; RG-Brainbow; Emx1-Cre (Memo1 cKOEmx) (B and D) mice at E16 (A and B) and P0 (C and D). High-magnification images of basal processes (yellow boxes) are shown in right panels. Control RGCs show single polarized basal processes (arrow, A, C). Mutant RGCs display extensive branching in their basal processes (arrowheads, B, D). (E-H) Representative images of RG basal processes in control (E and G) and Memo1 cKOEmx (F and H) cortices at E16 (E and F) and P0 (G and H). (I) Quantification of the basal process branching (top), endfeet branches per RGC (bottom), and % RGCs with pial attachment (bottom). Inset (I’) shows representative images RGC endfeet in control and Memo1 cKOEmx cortices at E16. Yellow dotted lines indicate the pial surface. Memo1 cKO RGC endfeet branches not attached to the pial surface are indicated by cyan arrowheads. (I”) Pial membrane is intact in both control and Memo1 cKOEmx cortices. For the basal process branching, branch number / 100 μm was quantified and used as branching index. Pial attachment was calculated by dividing the number of RGCs without pial attachment by the total number of RGCs counted. Data shown are mean ± SEM from 33 (control) and 37 (Memo1 cKOEmx) cells [E16] and 52 (control) and 51 (Memo1 cKOEmx) cells [P0] from 5 or more mice per group. (J-L) Radial progenitor morphology in P0 Memo1Lox/+; RG-Brainbow; hGFAP-Cre (J) and Memo1Lox/Lox; RG-Brainbow; hGFAP-Cre (Memo1 cKOhGFAP, K and L) cortices. High-magnification images of basal processes from J and K are shown in J’ and K’. While control RGCs show single polarized basal processes (arrow, J’), mutant RGCs display extensive basal process branching (arrowheads, K’, L). (M-P) RC2 immunostaining of E16 (M and N) and P0 (O and P) dorsal cortices. High-magnification images of basal process array (boxes) are shown in bottom panels. Memo1 mutants show disrupted arrayed organization and branching of basal processes (arrowheads) while control has regularly interspaced basal process array (arrows). (Q-T) The VZ of E16 (Q and R) and P0 (S and T) control (Q and S) and Memo1 cKOEmx (R and T) cortex showing aberrant spatial arrangement of radial progenitors in Memo1 cKO. (U) Co-labeling of E16 Memo1Lox/+; Emx1-Cre and Memo1Lox/Lox; Emx1-Cre dorsal cortices with anti-Pax6 and Tbr2 antibodies. Pax6+ and Tbr2+ progenitors delaminate and form ectopias at the IZ in the Memo1-deficient cortex (arrowheads). (V and W) Co-immunolabeling of E16 dorsal cortices with anti-Pax6 and anti-BrdU (V) or anti-Tbr2 and anti-BrdU (W) antibodies after pulse labeling of proliferating progenitor populations with BrdU (50 mg/kg, 1 hr. before sacrifice). (X) Quantification of progenitor proliferation and delamination. Data shown are mean ± SEM (n=3 mice/genotype). Memo1 cKOEmx cortex shows increased number of ectopic progenitors that remain proliferative. Student’s t-test; *P < 0.05 and ***P < 0.001. Scale bar: A, B (18 μm), C, D, I”, M-P (30 μm), E-H, J-L (8 μm), I’ (15 μm), Q-T (10 μm), U (35 μm), and V, W (20 μm). See also Figures S1–4 and S6–8.

