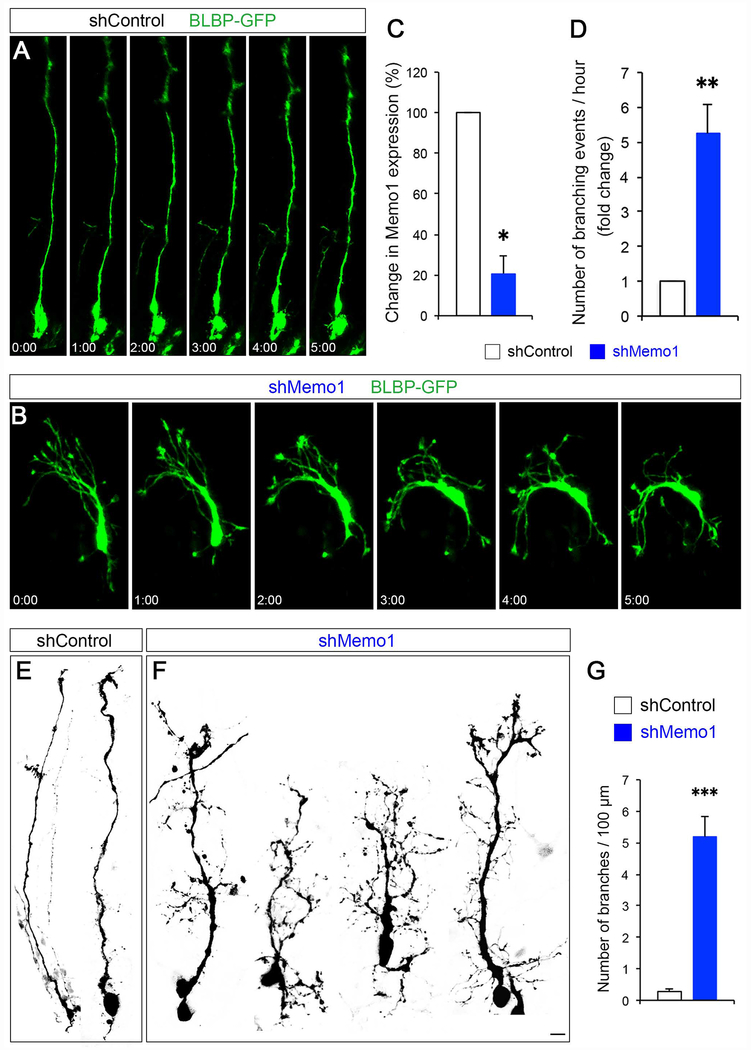
Figure 2: Effect of Memo1 knockdown on RGCs.
(A and B) Real-time imaging of RGCs following acute inactivation of Memo1. Control (A) or Memo1 shRNA (B) were co-electroporated with BLBP-GFP at E14 and BLBP-GFP+ RGCs were live-imaged at E15. Basal processes of Memo1-deficient RGCs lose their polarity and randomly sprouted multiple branches along the primary basal process. Time elapsed is indicated in hours and minutes. (C) ShRNA-mediated knockdown of Memo1. Knockdown efficacy of shRNAs (fold change compared to control) was examined by quantitative real-time PCR. Data shown are mean ± SEM (n=3 for each condition). (D) Quantification of the basal process branching events / hour. Data shown are mean ± SEM (n=13 cells from 3 mice for each condition). (E and F) Representative examples of the morphology of control (E) and Memo1-deficient (F) RGCs. shMemo1-treated RGCs do not form polarized basal processes and show excessive branching. (G) Quantification of the basal process branching. Data shown are mean ± SEM (n=14 cells from 3 mice for each condition). Student’s t-test; **P < 0.01 and ***P < 0.001. Scale bar: A, B, D, and E (10 μm). See also Supplemental Movie 1.

