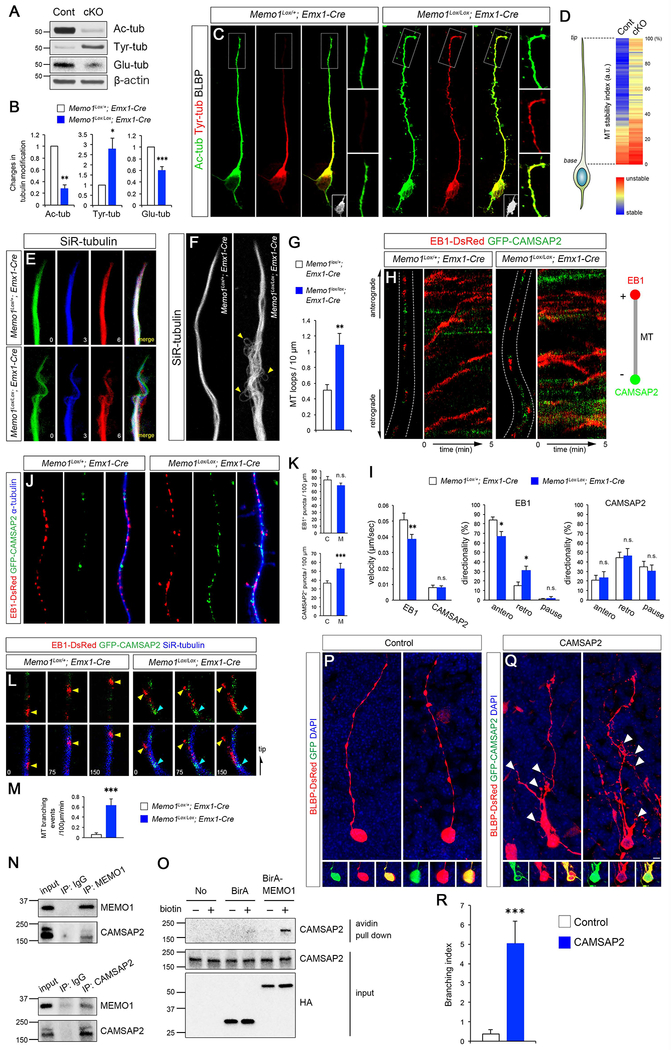
Figure 5: Altered MT stability and dynamics in Memo1-deficient RGCs.
(A) Dorsal cortical lysates from Memo1Lox/+; Emx1-Cre and Memo1Lox/Lox; Emx1-Cre mice (P0) were analyzed for tubulin post-translational modifications. An inversion of the MT acetylation/tyrosination ratio is evident in the Memo1-deficient cortex. (B) Quantification of tubulin modification. The intensities of acetylated, tyrosinated, and glutamylated tubulin bands were measured and normalized to those of β-actin. Data shown are mean ± SEM (n=5 mice/genotype). (C) Tubulin acetylation and tyrosination in RGCs in vitro. Outlined areas show sustained tubulin tyrosination at the tip of the Memo1 cKO RGC basal process. RGC identity of these cells was validated by BLBP immunolabeling (insets). (D) Quantification of MT stability along radial glial processes. Tyrosination/acetylation ratio was measured along radial glial processes. Data shown are mean ± SEM from 21 (control) and 20 (Memo1 cKO) cells from 5 mice/genotype. (E) Real time observation of MT dynamics in RGC processes. MTs labeled with SiR-tubulin in Memo1 cKO RGCs show highly dynamic behavior when compared to controls. Time elapsed is indicated in minutes and MTs from each time point are pseudo colored. (F) MT bundles within RGC processes visualized with SiR-tubulin, showing aberrant MT fasciculation and MT looping defects (arrowheads) in Memo1-deficient RGCs. (G) Quantification of loop-like MT structures. Data shown are mean ± SEM from 18 (control) and 19 (Memo1 cKO) cells from 4 mice/genotype. (H) Real time imaging of MT plus- and minus-ends labeled with EB1-DsRed and GFP-CAMSAP2, respectively, in radial processes. The movement of plus- and minus-ends are shown in kymographs (right). (I) Quantification of the velocity and directionality of EB1- and CAMSAP2-positive ends. Data shown are mean ± SEM (n=25 cells from 5 mice/genotype). (J) Distribution of EB1- and CAMSAP2-positive MT ends in radial processes, showing increased minus-end labeled MTs in Memo1 cKO RGC processes. (K) Quantification of plus and minus-end labeled MTs. Data shown are mean ± SEM (n=15 cells from 4 mice/genotype). (L) Time lapse images of EB1-DsRed (yellow arrowheads) and GFP-CAMSAP2 (cyan arrowheads) along SiR-tubulin-labeled MTs in the basal processes, showing initiation of EB1-tagged MT branches from CAMSAP2+ minus-end in Memo1 cKO RGCs. (M) Quantification of MT branching events (MT branching/100 μm/min). Data shown are mean ± SEM (n=20 cells from 5 mice/genotype). (N) Co-immunoprecipitation of Memo1 and CAMSAP2 in P0 cortical lysates. (O) Proximity biotinylation assays with HEK293T cells. Strong biotinylation of CAMSAP2 by BirA-Memo1 indicate their intracellular association. (P-R) CAMSAP2 overexpression leads to extensive RGC basal process branching in RGCs. (P-Q) RGCs in E14 cortex were co-electroporated with BLBP-DsRed and GFP (P) or CAMSAP2-GFP (Q), and analyzed at E16. While control RGCs display characteristic polarized basal processes, CAMSAP2-expressing RGCs show excessive basal process branching (white arrowheads). (R) Quantification of the basal process branching. Branch number /100 μm was quantified and used as branching index. Data shown are mean ± SEM (n=26 cells from 4 mice for each condition). Student’s t-test; *P < 0.05, **P < 0.01, and ***P < 0.001. Scale bar: C (5 μm), E, H, L (0.8 μm), F (1.5 μm), J (1 μm), and P, R (10 μm). See also Figure S9 and Supplemental Movie 3.

