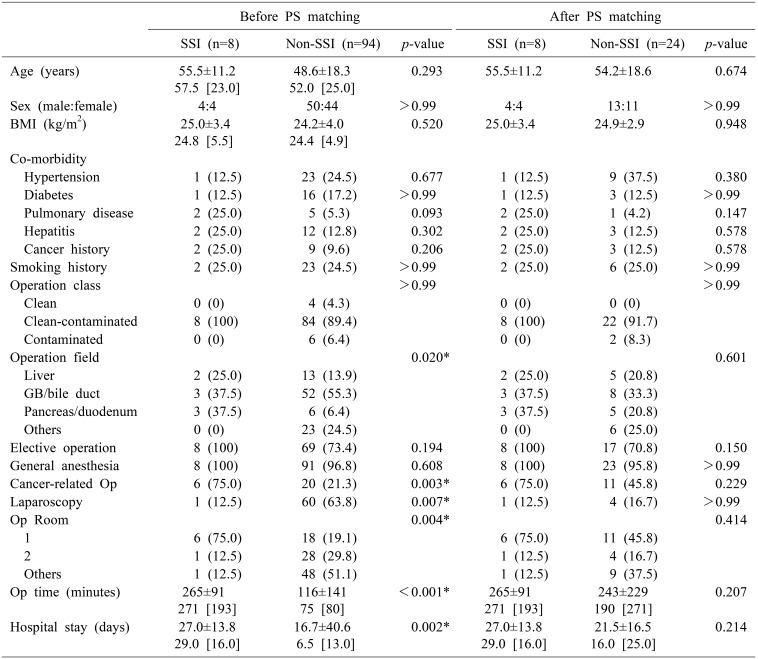
Table 1. Comparison of clinical data between patients with and those without surgical site infection before and after propensity score matching.
Values are presented as mean±standard deviation, median [interquartile range], or n (%)
BMI, body mass index; GB, gallbladder; MRSA, methicillin-resistant Staphylococcus aureus; Op, operation; PS, propensity score; SSI, surgical site infection
*Statistically significant

