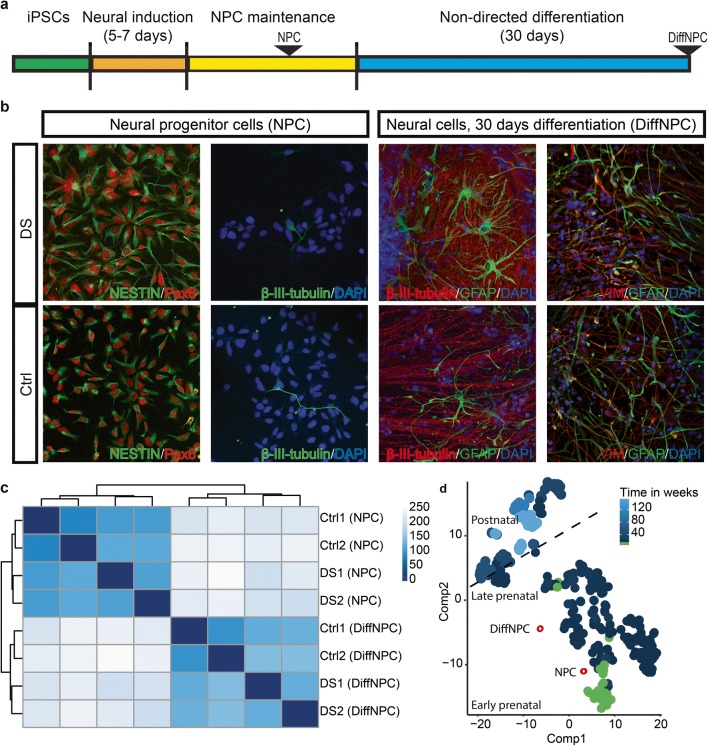
Fig. 1.
Generation and characterization of the iPSC model. a Schematic presentation of the protocol used to generate NPCs and DiffNPCs from iPSCs. b Representative images of immunofluorescent stainings of cells with full trisomy 21 (DS) and euploid control (Ctrl) cells. Panels show neural progenitor cells (NPC) stained for NESTIN and Pax6 as well as differentiated neural progenitor cells (DiffNPCs; 30 days of non-directed differentiation) stained for β-III-tubulin/TUJ1, GFAP and Vimentin. c Heatmap of transcriptome sample-to-sample distances using the rlog-transformed values (DS1 and DS2: neural iPSC lines with T21; Ctrl1 and Ctrl2: euploid neural iPSC lines). d Clustering of transcriptome data from neural iPSC lines derived from the two healthy donors and at two differentiation time points (NPC and DiffNPC; red circles) together with transcriptomes from Brainspan brain samples of different post-conceptional weeks (pcw) using tSNE plot. Brainspan samples represent fetal ages up to 200 pcw. Early fetal samples at age between 8 and 10 pcw are coloured green (n = 30) and remaining fetal samples are coloured in different blue shades corresponding to their gestational ages > 10 pcw. The dashed line indicates estimated position of clusters at full term. Clustering of samples was performed using the key gene set

